I’ve spent more than two decades in the streaming industry and the progress that many of us have witnessed, as consumers and professionals, is truly remarkable. Today, Internet-delivered video is pushing traditional broadcasters to upgrade the user-experience as consumers have learned that sometimes, as is the case with 4K, the highest quality video is often available by streaming rather than pay TV. It’s a testament to the scores of committed engineers who’ve come together to develop the underlying standards, technologies, architectures, and codecs that make it all possible.
Not only did the standards bodies need to develop the technologies and apply them, but many individuals and companies had to take a risk and adopt them. Consider where we’d be if DirecTV and the DVD Forum had not chosen MPEG-2. And it was the AVC codec standard that enabled HD video with ATSC, Blu-ray, and streaming. In turn, for the streaming industry, HEVC enabled a step function to occur in home entertainment video and streaming with 4K, HDR, and real-life colors.
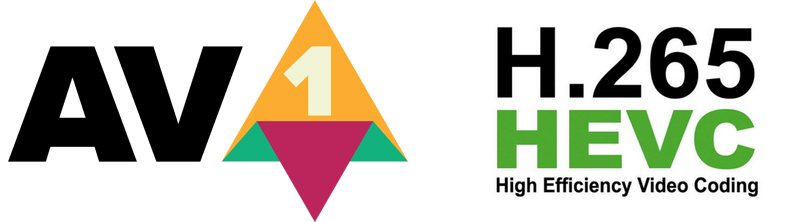
As far as we’ve come, codec innovation hasn’t stalled or stopped. VVC, the successor to HEVC, is now in the wild, and the Alliance for Open Media (AOM) AV1 codec, with its powerful group of supporters like YouTube, Netflix, Twitch, Amazon, Facebook, Apple, Microsoft and others, are streaming video at bitrates that are 30%-50% less than HEVC. But, for every ecosystem that has moved through the innovation curve to sustaining technology development, the pull from entrenched legacy architectures can overwhelm even the most progressive and forward-leaning technology organizations. In this reality, five nine’s uptime and net promoter scores (NPS) become the standard that governs technology choices as consumers move from, “I can’t believe I can get the game here, even with the glitches,” to “Why did my video service go out right in the middle of the game?”
In particular, we’ve seen some media and entertainment companies in the industry pushing the pedal down hard with innovation, betting on their success if they can provide the best QoE possible. Simultaneously, there is a consistent wish in preserving legacy technology deployments and architectures, hoping to stretch the previous technology investments for another few years. The trouble with this thinking is that we are in one of the fastest moving competitive cycles the industry has ever experienced. One has to look no further than Disney, who signed up 65 million paying subscribers for their Disney+ streaming service in under 12 months. As a whole, the industry needs to embrace a spirit of continuous innovation to remain competitive with fast-moving entrants that do not see technology risk as something to be avoided but rather a competitive advantage.
It’s not that the entire industry needs an innovation “wake up call.” In my conversations with operators, vendors, and streaming services worldwide, I’ve noticed a stark contrast between video teams’ attitudes working in Asia and India, compared to the U.S. For example, Asian operators are far more likely to take some operational risk in the short term to gain a competitive advantage in the medium term. One example of Asian video services taking short term risk for a tangible benefit is the overwhelming adoption of HEVC for all content, unlike in the U.S., where HEVC is used only for UHD content. In Asia, many video services have assumed an early technology adopter stance and use advanced codecs as a competitive advantage to reduce operational cost, improve quality, and increase streaming user experience. Contrast this with leading services in the U.S. who are still mainly using the tried and true 17-year-old AVC codec even when a sufficiently high number of user devices, or their owned and controlled set-top boxes, support HEVC natively.
In the streaming industry, innovation that fosters adoption, is the surest way to compete and win. In a recent enlightening video chat I had with Zoe Liu, the co-founder of Visionular, a video encoding company with more than twenty customers in Asia and India, Zoe confirmed that almost all UGC, RTC, and premium video streaming services in Asia use HEVC; and many are in evaluation or have begun the adoption of AV1. Zoe pointed out that, “they see the bitrate savings of HEVC and now AV1 as a huge competitive driver. A new codec standard like HEVC or AV1 allows them to increase resolution while upgrading their video quality, even while the bandwidth needed stays the same or goes down. The resulting consumer experience benefit is well understood, and services are willing to do a little extra work today because the user benefits far outweigh the risk. Asian video companies’ mindset is not to adopt the latest standard is to admit that a service is not trying to be the best.”
Consumer services in Asia that have embraced advanced codec technology standards include iQIYI, Bilibili, and Huya, all NASDAQ listed companies. Far from fledgling companies, Huya is the smallest with a $6 billion market cap, while both iQIYI and Bilibili are valued at $16 billion and $16.3 billion, respectively. The business models and consumer services that these three companies offer are varied, yet, they all heavily depend on being an early adopter of video technology as a differentiation advantage. For example, iQIYI is an innovative market-leading online entertainment service operating in China with 530 million monthly active users. They are one of the largest online video platforms globally and are a member of the Alliance for Open Media (AOM) and a current user of HEVC. As an early AOMedia member, iQIYI has developed QAV1, a proprietary AV1 standard-based encoder to help them meet consumer demand for advanced technology and entertainment experiences, including UHD 4K and 8K Ultra HD.
Bilibili is the Chinese equivalent of YouTube. In the first quarter of 2020, Bilibili reported 172 million monthly active users. On August 3, 2020, Bilibili announced a strategic partnership with Riot Games, granting the video service a three-year exclusive license for live broadcasting of the League of Legend Esports global events (in Mandarin only), including the world-renowned League of Legend World Championship, Mid-Season Invitational, and All-Star Event in China. These are presumably large high profile streaming productions. Thus it says a lot to know that they are using HEVC and purport to be actively looking at AV1 and VVC.
Huya is an ultra-low latency live streaming platform that serves 168.5 million users video game footage monthly. As more than one billion people worldwide watch streamed video gameplay every month, according to GlobalWebIndex, Huya is well-positioned for growth. And this makes their choice of HEVC and AV1 all the more relevant, given that nearly half of Huya Live users are accessing the service from a mobile device. Even with HEVC hardware decoders not fully deployed across the mobile landscape, and with AV1 decode limited to software, it says a lot that Huya is willing to risk some viewers not being able to access the technology. Because of the overwhelming benefits that HEVC and AV1 can deliver to most of their users, Huya sees that early adoption of these codec standards can help them stand out against their competitors.
With consumers globally having so many choices when it comes to live and on-demand video content, and the fierce competition amongst OTT services to grab market share, video services can differentiate by taking small operational risks. The question then is what to do when a codec swap, or new technology adoption, is not as simple as cutting over to the latest and greatest standard? The value promise for most streaming services is that viewers can watch content anytime, anyplace, and anywhere. When we consider the rapid advancements in the video codec space, and with a new and “better” standard always just a few years off, video engineers and technical leaders face pressure to default to the mean of AVC. After all, the royalty situation is understood, the playback ecosystem is ubiquitous, and finding video engineers knowledgeable about x264 is relatively easy.
There is never a significant gain in business, without some sacrifice and risk. Staying the course by sticking with a legacy tech stack, I believe, could cause a video service to be unable to compete with what viewers now demand from the user-experience. After all, what do you do when your competitor can deliver higher quality video with a better streaming UX because of the lower bitrates that their technology choice enables? The answer to this dilemma is continuous innovation as a competitive strategy. When you consider that even ten years ago, Asia was nowhere close to the U.S. in video streaming capability, but is now delivering the largest streaming events ever. With 870 million monthly users in Asia relying on video standards that U.S. companies are basically dismissing as not being needed, this is a strong statement to the power of innovation and the speed that it can propel a company from non-competitive to the leader.
In the global competitive environment that we are in, and with so many entertainment options competing for our attention and time, it’s not sufficient to merely keep pace with those services that we consider to be competitors. By adopting a spirit of continuous innovation and leveraging the best solutions and technologies available, companies will be in a prime position to improve how they encode video to deliver a better experience to their users. This will put distance between those who insist on doing what’s safe, and the companies willing to move fast, not to break things, but to learn quickly to have the best possible solution.

 With Fastly’s announcement of their intent to acquire web application security company Signal Sciences [