
Detailing the Privacy and Performance Problems with Cloudflare’s Oblivious DNS Over HTTPS Announcement
Recently Cloudflare announced that their researchers have been working to improve internet privacy and security through a DNS protocol called Oblivious DNS over HTTPS, or ODoH. While the announcement suggests that it will improve internet privacy, their proposal can actually lead to significant privacy issues, if it’s adopted. In addition, as it is written today, ODoH is likely to seriously impact internet performance or force providers to invest in software and process changes because it strips information that ISPs and CDNs require to do effective and efficient mapping to ensure performance for their users.
The IETF is an internet standards body made up of an international community of network designers, operators, vendors, and researchers concerned with the evolution of the Internet architecture and the smooth operation of the internet. Community members bring proposals for internet standards to the IETF through published “drafts”, mailing lists, and typically through in-person meetings. Proposals are submitted, and require working groups to pick them up in order to progress them into standards.
At this point, ODoH is an early-stage draft proposal which has been discussed in the “dprive” (DNS Privacy) working group but not yet adopted there, meaning that it is in a formative stage. Common practices to encourage the IETF to adopt work in a working group include deploying production implementations of proposed technologies, and driving interest and support from vendors and businesses, which is what Cloudflare is doing with their announcement.
So why is there contention around the proposal? Cloudflare’s head of research Nick Sullivan has stated that ”sweeping technical changes to the internet will inevitably also impact the technical community. Adopting these new protocols may have legal and policy implications.” Some of these legal and policy implications are detailed in a blog authored by Akamai Fellow Erik Nygren, back in 2018 on what encrypted DNS means for the Internet as a whole.
ODoH is an extension of DoH, so let’s start with that. The protocol exists because DNS queries are sent in cleartext. This means anyone on the network path between a user’s device and the DNS resolver can see both the query that contains the website the user wants to visit, as well as the IP address that identifies their device. Both protocols are designed to increase user privacy by preventing queries from being intercepted, redirected, or modified between the client and resolver – something known as a middle (MiTM) attack. DoH encrypts communications from the client to its resolver, and ODoH takes this a step further to obscure the client from the resolver.
DoH itself is just a protocol for doing DNS lookups over HTTPS. Most of the contention comes from ways in which DoH resolvers might be discovered and configured. For example, when DoH is used at the application level, it can bypass name servers configured at the OS level. So a web browser can come with a list of DoH compatible resolvers already configured, and traffic from that client would then use those DNS settings.
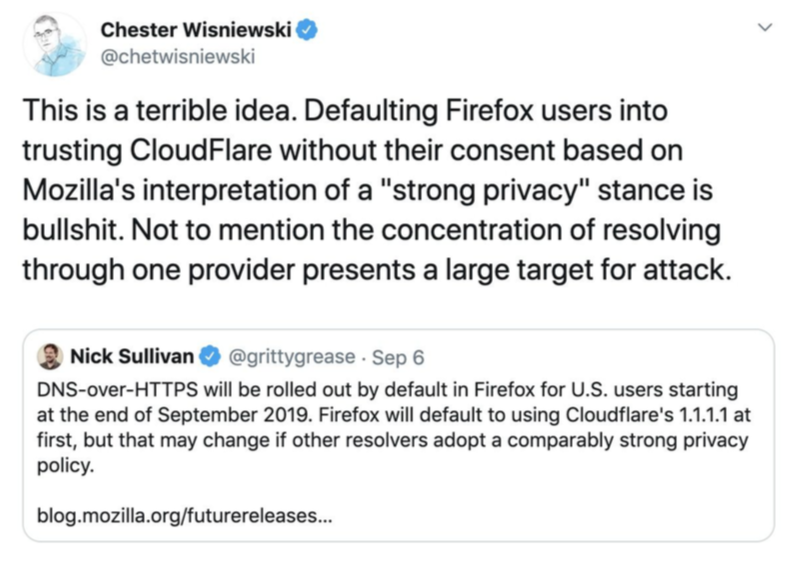
In 2019 Mozilla turned on DoH by default for all Firefox users, using Cloudflare as the server. This meant that the browser would prefer DoH via Cloudflare. This has been heavily criticized as an anti-privacy move, since Mozilla is essentially handing off all DNS resolutions to a single for-profit corporation. ISPs expressed concerns over their ability to perform lawful interception and content filtering (for example, legal requirements or parental controls), and many feel that since Cloudflare is an American company, this could not only be centralizing a large portion of the internet but also making it subject to law enforcement from a single government.
To explain this, switching from using an ISP’s local in-country DNS resolver to a DNS resolver that is out-of-country could make both privacy and performance worse rather than better, regardless of what communications transport is being used for the DNS. Consolidating DNS lookups to a few services also introduces new risks for enabling the correlation of user activity, and these services potentially become highly attractive targets for subpoenas and extra-legal attacks. This is all made substantially more challenging as many users lack a way to judge the level of trust they have with various DNS service providers, making it hard for them to make an informed choice.
So Cloudflare’s ODoH announcement is their way of asserting that they will provide users with an option not to send IP information to their DNS resolvers, which Cloudflare claims will ensure privacy. But this introduces another challenge: that ODoH will impact performance because it introduces significant latency, and also strips information that is required to do effective and efficient CDN mapping. Cloudflare’s research paper about ODoH provides testing conditions that are not relevant to the real-world, and the performance impact numbers mask latency introduced by load times for real web applications.
There are a wide range of other options being explored by the IETF. Given the wide variety of use cases, there is not likely to be a single solution. Many of the leading proposals involve a mixture of sources for secure DNS resolver configuration, device policy, associated and designated resolvers, and user choice. Something like ODoH may fit into this for resolving names where performance may be traded off for possibly improving privacy, but at this point, the concerns and potential pitfalls seem to outweigh the benefits.


 With Black Friday almost here, I’ve compiled a list of the best deals when it comes to streaming media devices. I’ve not included pricing for the new Xbox Series X/S and PS5 gaming consoles since inventory is extremely limited and pricing varies based on all the bundles offered.