Since I write about vendors, I want to disclose that, effective December 2nd, I have become a minority shareholder in Hydrolix through a personal investment in the company. This is only the second time I have invested in a company in the streaming industry, the other being my seed investment in Datazoom, which I disclosed in a blog post in 2018.
Hydrolix really came onto my radar about 18 months ago when they started hiring a lot of smart people across the industry I respect, and I began to hear their name mentioned by many large OTT platforms and broadcasters, impressed with their platform. I’ve been saying for years that the ingestion, processing, and storage of user data tied to the streaming media workflow are the industry’s most significant problems. It’s not video compression, delivery or playback. Today, many large companies process over 1 billion transactions per day and ingesting and analyzing data at that scale has historically been impossible.
If you can’t manage it, you can’t measure it. And that’s the point of Hydrolix’s real-time data platform, which helps businesses manage and analyze massive volumes of data, enabling them to make informed decisions about their business. The challenges media and entertainment customers face with the volume of data they collect across siloed systems and multiple dashboards are real problems. Many store only 1% of the data they collect and discard the rest due to storage costs, or store it in cold storage, making it inaccessible in real time. These are all problems Hydrolix is working to solve for companies such as FOX, DAZN, and TF1. Further, through their OEM with Akamai, they’re delivering ingest and insights for over 600+ other major media, entertainment, and OTT leaders.
The company recently announced a new real-time CDN observability capability across companies’ distributed infrastructure, from edge to enterprise. This opens their solution for use across any of the major CDN providers. It also solves a critical need for anyone using a multi-CDN strategy, providing critical real-time correlation. While Hydrolix is known across the streaming market, video customers aren’t the only ones they support. The company also pulls in data tied to ad tech, cybersecurity, AIops and ITops. It is deeply integrated with AWS, offering a managed service for origin-to-edge observability for AWS CloudFront, AWS WAF, and AWS Elemental and with Akamai’s Connected Cloud, helping their customers detect and address performance and security issues proactively.
Hydrolix’s CEO Marty Kagan, co-founder of Cedexis in 2008, is a name many readers from the streaming industry will remember. Cedexis’s flagship product, Radar, monitored the quality of experience delivered by third-party CDNs to their customers, which was later acquired by Citrix in 2018. Before Cedexis, Marty spent over 8 years at Akamai. Across the company, there are some really smart people at Hydrolix working to solve big data problems for multiple industries and some of the largest Fortune 500 companies. I like what Marty and the Hydrolix team are building, the way they are going about it and the importance of their data platform that powers these critical data-intensive applications.
In Q1 of 2025, Hydrolix raised $80 million in a Series C round and has raised $140M to date. The company crossed $50 million in annual recurring revenue (ARR) in April of 2025. If you want to learn more about Hydrolix, you can listen to my podcast with Marty, recorded earlier in the year, before I was a shareholder.
Disclaimer: I have never bought, sold, or traded any shares in any public CDNs, and even in my managed portfolios, CDNs are excluded. I was previously a shareholder in MediaPublisher and Encoding.com through share grants as an advisor, not via an investment. Aside from Datazoom and Hydrolix, I do not own any other shares of any other vendor in the streaming media industry.

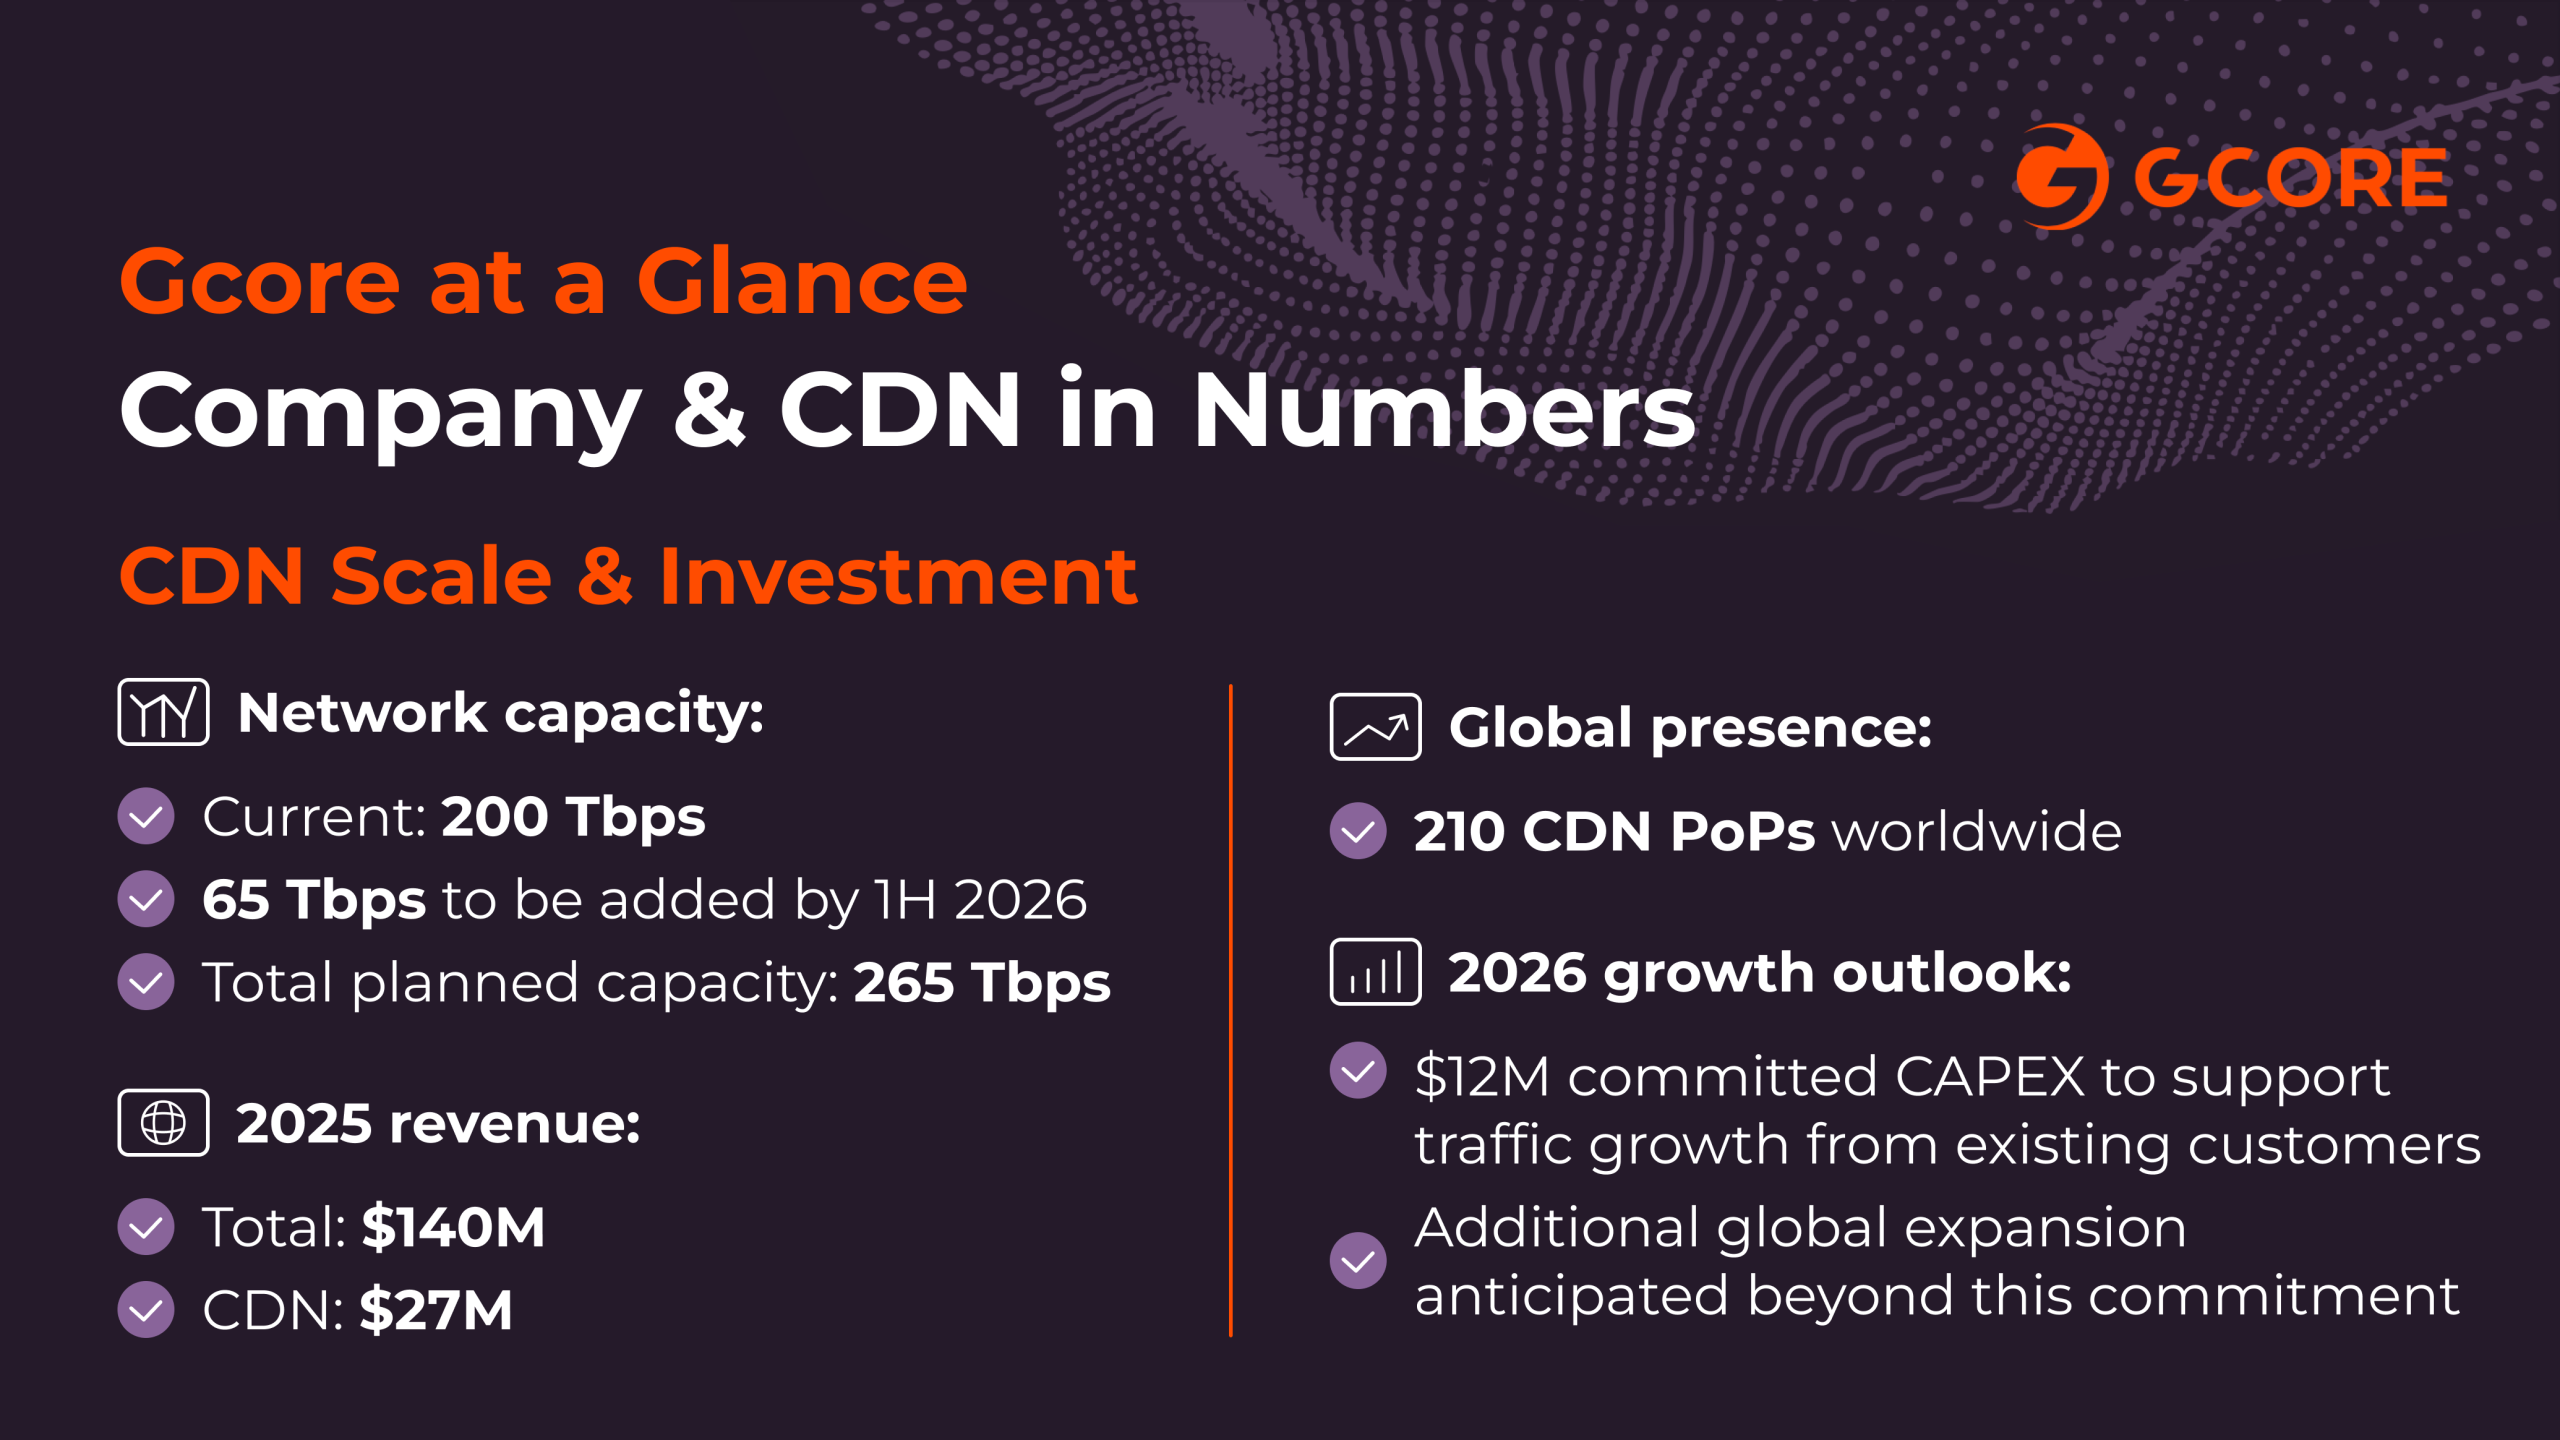 Privately held CDN and infrastructure provider Gcore, headquartered in Luxembourg, is allowing me to disclose some of its financial figures, which show significant revenue growth over the past two years. The company ended 2025 with $140 million in revenue, of which CDN-specific revenue was $27 million.