For the past two days, I’ve been using Amazon’s new Vega OS-based Fire TV Stick, and I’m not impressed. Amazon claims the value of the latest model is “remarkably fast app launches,” but when tested against the Fire TV Stick Max, there’s no difference in speed.
I tested Netflix and Prime Video load times on both devices ten times each, and the average load time for Netflix on the Vega-based device was 14.03 seconds. On the Max device, the average time was 14.06 seconds. When testing Amazon’s Prime Video app, the average load time was 10.2 seconds on the Vega-based device and 11.3 seconds on the Max device. No customer is going to notice a fraction of a second in app loading times.
The Max device does boast better specs, featuring 2GB of memory and a Quad-core 2.0GHz processor, compared to the Select’s 1 GB and Quad-core 1.7 GHz. But according to Amazon, the Vega-based device doesn’t require as much memory or a faster processor because container apps in the cloud are streaming the actual app from Amazon’s cloud servers.
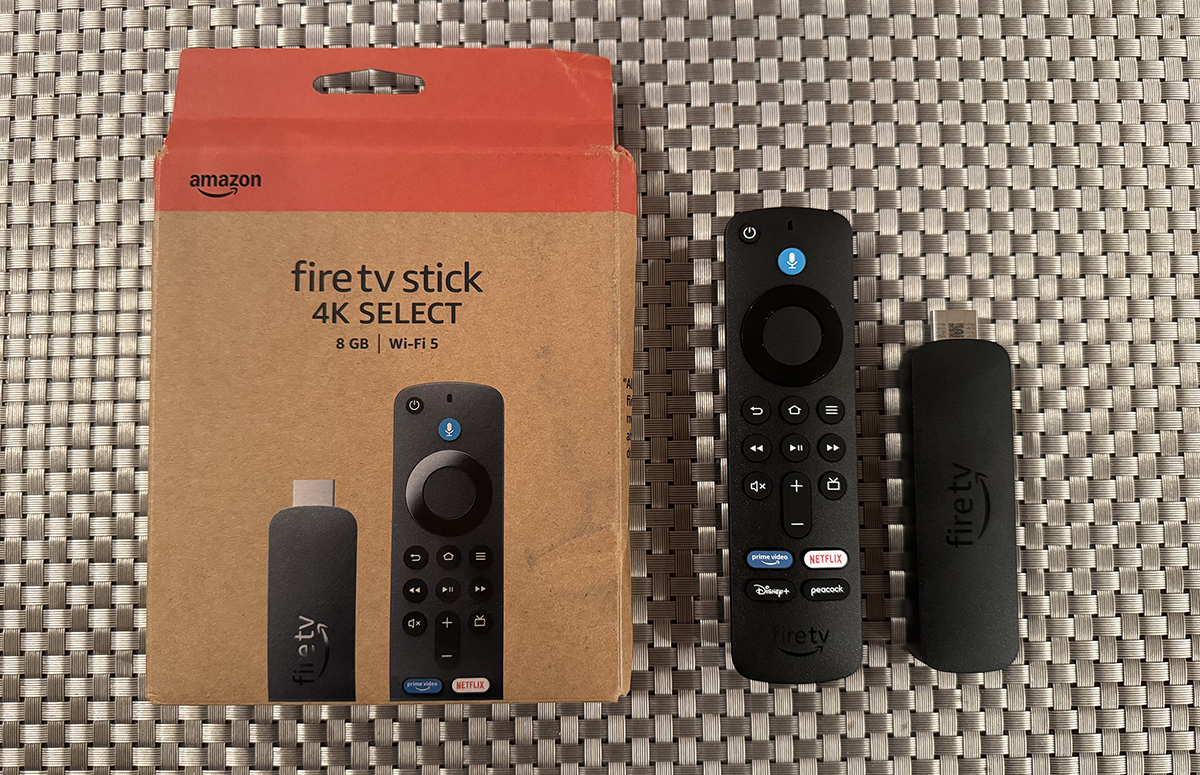
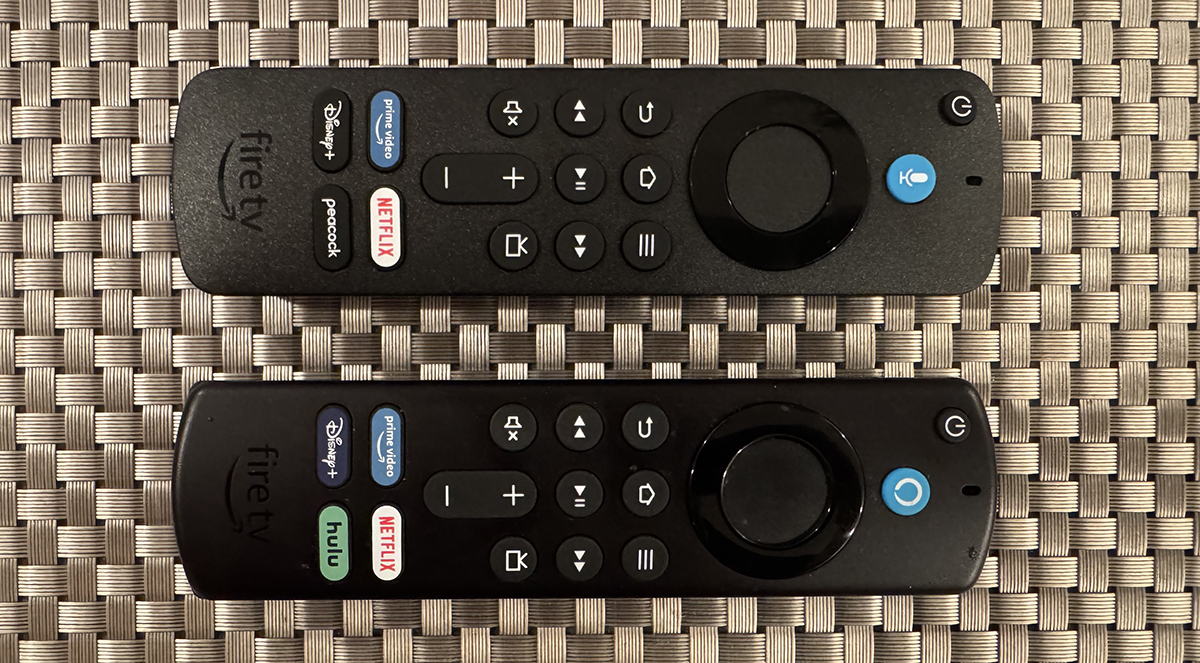
Setting up the device took nine minutes because the remote wouldn’t pair out of the box. It kept telling me to use new batteries, despite them being new from Amazon, as verified by a battery tester. The device required a software update as expected, followed by a four-minute restart. An hour after using the device, the remote decided to do a two-minute software update. The new Select device features a more rounded remote and has replaced the dedicated Hulu button with one for Peacock.
I’ve come across a few online mentions suggesting it is possible to sideload apps onto a Vega OS Fire TV device using a command-line interface similar to Android’s ADB utility; however, I don’t see how that is possible, and I haven’t seen anyone demonstrate it working in the wild. Unlike Android-based Fire TV devices, where you can turn on Developer Options in the About section, I’ve not found any way to do this on the Vega-based device. I “think” that only registered developers will be able to enable developer mode. Still, it’s unclear at this time, and I don’t know what the reference means in Amazon’s documentation when it lists a command for running an app that has been sideloaded.
For developers whose app is delivered via Amazon cloud app streaming, note that the Vega-based stick won’t support local device access, picture-in-picture, live TV EPG integration and continue watching row references. Amazon also notes that running the Fire OS app in a cloud container will cause the IP address seen by the developers’ content delivery network to not align with the IP address seen by the developers’ back-end servers. As a result, Amazon says local ad targeting may not function correctly, VPN inhibitors might be falsely triggered, other geo-fencing solutions might not function as expected, and High-traffic events might trigger denial of service attack warnings.
To address these problems, Amazon says apps can be configured to support IP tunneling, where all IP traffic is routed through the device. However, Amazon notes that enabling IP tunneling may increase lag in customer interactions and reduce the speed of content catalog browsing and other app interactions, which is why it is not enabled by default. Amazon advises developers to contact Developer Support if they encounter this problem, to request that their app be enabled with IP tunneling. This all sounds like a lot of work for the developers to ensure customers get the experience they expect, and I wonder how many developers will dedicate time to supporting a single Fire TV model.
For an understanding of how video playback in Amazon cloud app streaming works, Amazon’s developer page provides a detailed step-by-step: (copied word for word from Amazon’s page)
- Customer UI interaction on device are sent to the app instance running on Fire OS in a cloud container.
- A customer interaction with app instance results in a content play request.
- App instance calls to developer CDN gets routed to on-device streaming player.
- App instance uses MediaDRM and MediaCodec interfaces which are bridged to device streaming player.
- Device media player fetches content from developer CDN.
- Device streaming player sends non-AV payload to app instance for state synchronization.
- Device streaming player decodes the AV payload using on-device secure video pipe.
- Playback information is synchronized between device and media player in app instance context.
- App instance streams UI to device client.
- App instance UI is composited along with the video content and rendered on the device screen.
The Vega-based Fire TV Stick currently costs $14 more than the newest Fire TV Stick 4K model, although pricing varies based on whatever discount Amazon is running at the time. No consumer will choose the more expensive model simply because it runs on an OS owned by Amazon. Of course, Amazon’s pricing strategy could quickly change at any time, and I expect it will.
I believe it will enable Amazon to offer the cheapest Fire TV model ever, as Vega OS is a simpler platform that requires less from the device’s hardware compared to Fire OS. That should be just fine for consumers who don’t care and overlook the limited capabilities and limited app ecosystem. A significant limitation is that the Select device does not support live view picture-in-picture. If customers purchase it under the assumption that it’s faster than the Max device, they will be disappointed.