Global CDN Services Market About $5B in 2023, Expected To Grow 3% In 2024, Driven by AWS

[The short URL for this blog post is cdnmarket.com] The market for third-party CDN services, which I define as the delivery of video and small and large objects, was about $5 billion in 2023, which I break down in detail below. This figure does not include revenue for services tied to security (WAF, DDoS, etc.), compute, hardware, and storage and excludes delivery in China. The number excludes any company with its own DIY CDN, like Netflix and YouTube, that doesnโ€™t sell its infrastructure as a service to other companies.

The figure also excludes revenue from vendors offering online video platforms, including Brightcove, Uplynk, AWS Media Services, Quickplay, Deltatre, Mediakind, Sports Radar, Cognizant, Endeavor Streaming, StreamAMG, Bedrock Streaming, etc., which combined saw revenue of about $1.8 billion in 2023. Based on what I know, AWS Media Services is the largest of the group, with about $450 million in revenue in 2023.

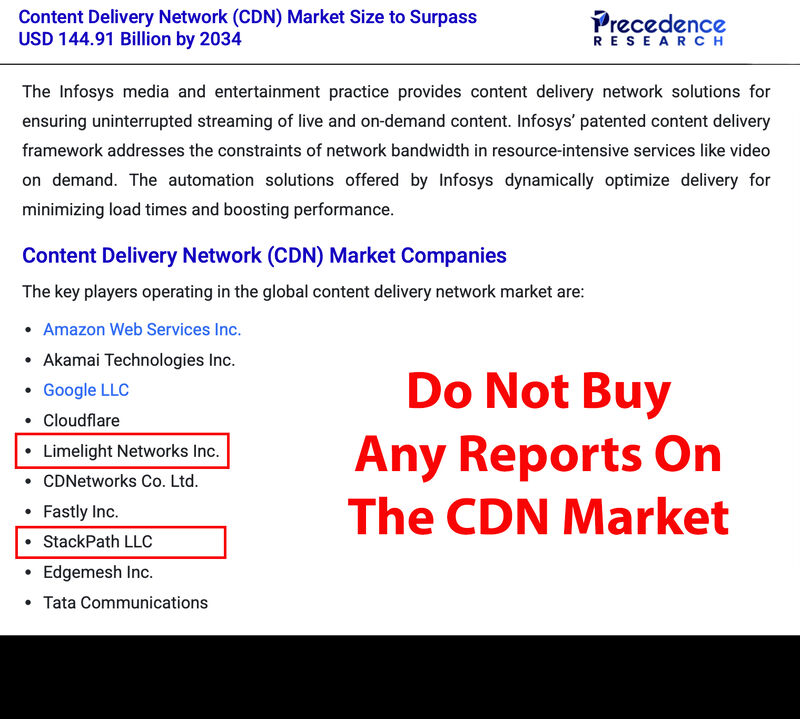
While reports produced by research firms say the CDN market was multiple times larger than my number, they are wrong. Full stop. Do not buy their reports. Akamai, Fastly, Edgio, CDN77, and others disclose enough details tied to their delivery revenue that we have numbers to form a good foundation for market sizing. The market is not as big as many suggest, and those writing about the size of the CDN space donโ€™t define it and include non-CDN services like transcoding, hardware, hosting, storage and transit in their numbers.

In most cases, these reports also include vendors who no longer exist in the market. Limelight Networks is frequently mentioned, yet it changed its name two years ago. CenturyLink changed its name to Lumen four years ago, and MaxCDN was acquired eight years ago. These bad reports also like to list vendors AT&T and Rackspace, neither of which has or sells its own CDN but resells Akamai and other third parties. Reports also list vendors like Imperva and Fortinet that don’t sell CDN services but cloud security services.

Many use public revenue numbers given out by Akamai and others incorrectly, changing the revenue definition to video when that’s not how the companies report it. Akamai breaks out company revenue into three buckets: “Delivery,” “Security,” and “Compute.” Fastly uses the terms “Network Services” (solutions designed to improve the performance of websites, apps, APIs, and digital media), “Security” (products designed to protect websites, apps, APIs, and users) and “other” (emerging products offering which includes compute and observability products). It’s important to understand these distinctions to interpret the revenue figures accurately.

Limelight Networks previously defined their revenue as delivery since, at the time, that was their primary service offered, and in their SEC filings, they broke out the percentage of their revenue tied to “delivery” services as nearly 80%. Since Edgio’s acquisition of Layer0 and Edgecast, their revenue is now blended across services outside of just bit delivery. With Edgio’s subsequent filing, we must see how they bucket their revenue and define it. However, we know how much revenue Layer0 and Edgecast had when acquired, separate from the Uplynk business. CDN77 breaks out revenue with the definition of “content delivery,” but no vendor has ever broken out revenue explicitly tied to the delivery of video content. Only once did Akamai disclose, during their 2021 investor summit, that for the fiscal year 2020, 57% of all the bits they delivered under their “Edge Delivery Traffic” heading were OTT/video. We all know that delivering video takes up the largest percentage of bits on any CDN while contributing the least amount of profitability as a service.

There are three main reasons why the CDN market has not grown at a higher CAGR rate over the past few years and will continue to be in the low single digits in the future. The first reason is that since the pandemic, all companies strive to be more efficient and do more with less. More than two years ago, I documented how many streaming services focused on optimizing their bitrates and, in some cases, reduced the highest rungs from their bitrate ladders to save money. Content owners, including Disney+ Hotstar and the BCC, documented on their tech blogs how they cut the number of bits they were delivering and optimized other cloud-related services to save money.

During Akamaiโ€™s Q2 2022 earnings call, the company highlighted this trend amongst customers and noted they saw reduced video bits delivered due to bitrate optimization. What started as a trend during the pandemic is now the new norm. An interesting data point that just came to light in Paramount Global’s presentation discussing their plans after they merge with Skydance is the company’s goal to “Unify cloud providers for all distribution services (e.g., Paramount+, Pluto) to provide CDN efficiencies.” Cost savings are the priority.

Previously, many clients evaluated traffic metrics, usually every quarter and allocated traffic at the regional level. Now, evaluations happen within days for some accounts or almost in real-time for others, with traffic relocations within a multi-CDN stack becoming significantly more dynamic and happening at the country or even single ISP level. As a result, more customers are no longer willing to make year-long and high-volume commitments. A data point to back this up comes from Fastly’s Q1 2024 earnings call when the company said, “We are seeing a slight uptick on the typical level of rerates with our largest customers, but we have not yet seen the commence or a traffic expansion usually associated with this motion.” In other words, there is pressure on CDN pricing, as always, with the largest customers demanding lower pricing, even without offering more traffic or larger commits.

The second main reason for CDN vendors’ lack of revenue growth is that a small number of customers account for the largest share of revenue. By my estimate, less than 50 customers of CDN services account for 75% of the revenue generated by third-party CDNs. We have data to back this up. As an example, for the year ended December 31, 2020, sales of Limelight’s top 20 customers accounted for approximately 75% of their total revenue, and they had two customers, Amazon and Sony, who represented approximately 36% and 11%, respectively, of their total revenue. Akamai had not broken out its split of customers the same way but disclosed for many years that when it broke out revenue under the “media” bucket, six customers accounted for 18% of its media revenue at the highpoint.

In Q1 of 2024, Akamai’s delivery revenue declined 11% year-over-year due to lower bitrates and lower pricing amongst a small concentration of large customers. Many assumed the decline was due to Akamai losing market share, but that wasn’t the case. Lower bits plus lower pricing equals a shrinking market for all CDN vendors. Multiple large customers, all repricing in the same quarter or year, hurt revenue growth. I’ll publish a post shortly on CDN pricing and highlights from my latest CDN pricing survey.

So, who are the largest CDN customers for content delivery? Here’s a list of customers spending more than $100 million annually on delivery services. It includes companies using third-party CDNs to deliver video, software downloads, and small object delivery, but it is not a complete list. Many customers are making revenue commits with CDNs across all the services offered, so contracts from the largest customers vary, and there are lots of variables based on the type of traffic and regions.

The list consists of Amazon Prime Video, Disney, Comcast, Paramount Global, Warner Bros. Discovery, TikTok, Microsoft, Apple, Sony Entertainment Network, Nintendo, Activision Blizzard, Electronic Arts, Riot Games, Valve, Take-Two Interactive, Roblox, Ubisoft, Roku, NFL, MLB, ESL FACEIT Group, Spotify, Reliance Industries (Jio), TV18 (Viacom18), Snap, The Times Group and Reddit amongst others. I’ve been collecting CDN pricing data for almost twenty years, routinely talking to many of the companies mentioned, and there are public data points one can look at tied to traffic volumes and public filings to get numbers. For instance, when Reddit filed to go public, their S-1 said they planned to spend at least $385M on cloud services by September 2026. Many of the details I have from the customers on what they buy from CDN vendors are off the record, or I am under NDA not to disclose it.

The third reason for the challenging market conditions is that 4K streaming simply isn’t in demand by consumers and isn’t driving more bits. Many streaming services charge more to stream in 4K, and consumers have shown that, in most cases, they are not willing to pay for it. And yet, the industry still wants to hype 4K, 8K, VR and AR as if they are catalysts for CDNs, which they aren’t. No NFL game, including the Super Bowl, is in 4K. Neither are streams from the NHL, MLB, MLS, or cricket games on Disney+ Hotstar and JioCinema. In 2014, I wrote a blog post entitled “The Dirty Little Secret About 4K Streaming: Content Owners Canโ€™t Afford The Bandwidth Costs,” which is still the case ten years later. Even big companies that could afford the additional costs that 4K brings, like Amazon, Google, and Apple, don’t offer 4K for Thursday Night Football, NFL Sunday Ticket or Friday Night Baseball. In 2022, multiple CDNs told me that of all the bits they would deliver that year, 4K/UHD would make up “less than” 10% of those bits, flat year-over-year. Last year, it was flat as well.

As I stated earlier, the total revenue of all vendors offering delivery services, excluding the China region, was about $5 billion in 2023. This includes delivery revenue from vendors listed at cdnlist.com and comprises Akamai, Amazon (Cloudfront), CDN77, Cloudflare, Comcast Technology Solutions, Edgio, Fastly, Google Cloud Media CDN, MainStreaming and Qwilt. It also combines revenue from smaller vendors into one number, including Bunny, CacheFly, CDNsun, Gcore, GlobalConnect, KeyCDN, Medianova, and other small regional CDNs.

In 2023, Akamai had $1.54 billion in delivery revenue, down 8% year-over-year. From 2021 to 2023, Akamai’s delivery revenue shrunk by over $300 million due to fewer bits being delivered, no adoption of 4K video, lower pricing, and all large customers using a multi-CDN strategy. These trends in the market impact Akamai the most since they are the largest vendor for delivery revenue. Amazon doesn’t disclose how much income they generate from CloudFront, but I put it at $1.1 billion in 2023. I am not disclosing my source for the number, but note that at one time, Amazon published how many paying customers they had on CloudFront.

Cloudflare had $1.29 billion in company revenue in 2023, up 33% year-over-year, of which I am counting $500 million towards my market sizing numbers. Cloudflare offers many cloud security and DNS services that would not fall under my definition of delivery, and the company does very little in the way of streaming. Fastly had $506 million in total revenue, of which I am counting $380 million towards delivery. Based on Fastly guiding Q1 2024, 79% of their revenue in the quarter came from “Network Services,” where delivery falls under. While we await an updated filing from Edgio, in November of 2023, the company guided to $392 million at the midpoint. Some of that revenue is tied to security and application services and Edgio’s Uplynk platform, so I am using $200 million from their revenue guidance for my market sizing number. CDN77 disclosed that their 2023 revenue was in the $ 140M-$150 million range and that they expect 40% growth in 2024. By my projections, the top six largest CDNs combined had revenue of $3.8B in 2023, making up 74% of the total market.

Outside of the top six largest CDN vendors, all other CDNs have less than $100 million in revenue. None of them, including Google, CTS, MainStreaming, Medianova, CacheFly or Qwilt, discloses revenue numbers publicly, and the numbers I have been given are under NDA or given to me only on background. Grouping all of them is another $400 million in 2023 revenue. In addition, many smaller regional CDNs around the world target SMB customers and those who don’t have a lot of traffic. By my last count, at least two dozen vendors were in this bucket, for which I estimate another $500 million a year in combined revenue. Of course, it has to be pointed out that while all these vendors fall under the category of delivery revenue, they don’t all compete. Many smaller customers spend less than $100 monthly, which is not a segment of the market that Akamai, Fastly or Edgio target. Adding up all these numbers brings the total 2023 revenue to $4.7 billion.

Separate from the revenue of CDN services, in 2023, approximately $200 million was generated from vendors offering a CDN platform to operators and carriers. These vendors include ATEME, Broadpeak, Gcore, Jet-Stream, Netskrt, Qwilt, Varnish Software, Vecima and Velocix, who license their software/platform to carriers, network operators and content owners who have a DIY CDN as part of their overall delivery strategy. While some of the vendors mentioned are public, for instance, Broadpeak and ATEME, none of the vendors break out the percentage of their revenue tied directly to their CDN platform offering. My $170 million number discounts their total revenue with the percentage I believe going toward their CDN product. In addition, in many cases, the vendor has privately told me the percentage of revenue without allowing me to break it out per vendor. The market for selling CDN platforms to carriers, network operators and content owners is tiny. In 2023, Broadpeak’s overall revenue was down 6.8% year-over-year.

Combining all vendors in the market broken out for content delivery, as I define it, puts the market at $4.9 billion in 2023 revenue. That number could fluctuate a few hundred million, depending on how much of a company’s total income is bucketed towards “delivery.” But as you can see, the numbers put out by firms that say the CDN market was $25.5 billion, $21.3 billion, $16.3 billion, or $13.2 billion are all wrong. Do not use those numbers. Overinflating the size of the market helps no one and sets false expectations.

Because of Amazon’s CloudFront offering, I expect the CDN market to grow in 2024. While most other large CDNs, including Akamai, Edgio, and Fastly, are seeing year-over-year revenue declines, I expect Amazon’s CloudFront revenue to grow 10% or more this year. Cloudflare and CDN77 will also see growth in their delivery business, which will help offset revenue declines from the other CDN vendors and help the overall market grow by about 3% in 2024. Without Amazon and Cloudflare growing, revenue growth of the CDN market would have been negative in 2023 and 2024. Amazon is winning more share of traffic in specific regions, including for cricket events in India and other large live events, as we recently saw with Peacock’s NFL Wild Card game. All customers of Peacock’s size use multiple CDNs, but they change how they split up the share of traffic. I’ve seen Amazon win more of a share of the traffic for large-scale live events and expect that to continue.

If you have any comments or questions on the topic, you can put them in the comments section on this post on LinkedIn or contact me directly at dan@danrayburn.com

Listen to my special CDN-focused podcast from July 2024 for more details and updates regarding 4K, low/ultra-low latency, CMCD, DIY (TikTok, Disney), Open Caching, pricing and multi-CDN.

Note: I have never bought, sold, or traded shares in any public CDN, and even in my managed portfolios, Akamai, Fastly, Cloudflare, and Edgio are excluded.

Sponsored by

Special CDN Podcast: The Latest Data on Pricing, Market Size, Tech Trends, DIY, Revenue, and Performance

In this comprehensive podcast update on the CDN market, I separate facts from opinions, providing a detailed analysis of the latest trends. I cover everything from CDN pricing trends, market sizing (๐š๐›๐จ๐ฎ๐ญ $๐Ÿ“.๐Ÿ‘๐ ๐ข๐ง ๐Ÿ๐ŸŽ๐Ÿ๐Ÿ‘), traffic and revenue growth rates, DIY initiatives (TikTok, Disney, Apple, Netflix), tech trends and demands across 4K, ULL, CMCD, bitrate optimization, multi-CDN, Open Caching deployments, changes in performance testing, to unique delivery challenges in regions like India.

Revenue numbers for CDN vendors, including Akamai Technologies, AWS, Cloudflare, CDN77, Edgio and Fastly, are broken out, along with where the numbers come from. Other CDNs discussed include Comcast Technology Solutions, Google Cloud Media CDN, Netskrt Systems Inc., Orange, Qwilt, Tata Communications and others.

I discuss the potential impact of market consolidation, Netflix streaming NFL games on Christmas, and the trend that will continue with customers looking to save on delivery costs. I also highlight bad data and red flags within reports in the market so you know what to avoid and data to stay away from. Listen here: ๐ŸŽ™ https://lnkd.in/epzXSMVA

I mentioned many numbers in the podcast, nearly all from public sources, and I believe I got them right. But if I misspoke, I welcome any corrections. If you have any questions, please put them in the comments section or contact me anytime. (dan@danrayburn.com)

My thanks to the nearly twenty CDN vendors, customers, sports leagues, OTT platforms, carriers and DIY content owners I spoke to in the week before the podcast.

The podcast transcript provided by my podcasting platform has many mistakes, so I will work on editing it and posting a transcript when I can.

NFL Dominates TV Viewership: Here’s How They Compare to MLB, NHL, NBA, US Open and Other Sports

Nothing even comes close to the viewership of NFL games. Below is a list of recent sports viewership numbers from the NHL, MLB, WNBA, NBA, Formula 1, U.S. Open, Indy 500, UFL and Premier League.

For comparison, for the 2022-23 NFL season, Monday Night Football on ESPN averaged ๐Ÿ๐Ÿ•.๐Ÿ ๐ฆ๐ข๐ฅ๐ฅ๐ข๐จ๐ง ๐ฏ๐ข๐ž๐ฐ๐ž๐ซ๐ฌ; Thursday Night Football on Prime Video averaged ๐Ÿ๐Ÿ.๐Ÿ– ๐ฆ๐ข๐ฅ๐ฅ๐ข๐จ๐ง ๐ฏ๐ข๐ž๐ฐ๐ž๐ซ๐ฌ; Sunday Night Football on NBC averaged ๐Ÿ๐Ÿ.๐Ÿ’ ๐ฆ๐ข๐ฅ๐ฅ๐ข๐จ๐ง ๐ฏ๐ข๐ž๐ฐ๐ž๐ซ๐ฌ; FOX averaged ๐Ÿ๐Ÿ— ๐ฆ๐ข๐ฅ๐ฅ๐ข๐จ๐ง ๐ฏ๐ข๐ž๐ฐ๐ž๐ซ๐ฌ; CBS averaged ๐Ÿ๐Ÿ—.๐Ÿ‘ ๐ฆ๐ข๐ฅ๐ฅ๐ข๐จ๐ง ๐ฏ๐ข๐ž๐ฐ๐ž๐ซ๐ฌ. Even the 2022 FIFA World Cup didnโ€™t come close to the NFL.

๐Ÿ€ ABCโ€™s Game 5 coverage of the NBA Championship final averaged 12.2 million viewers and peaked with 13.2 million viewers. The average audience for ๐๐๐€ ๐…๐ข๐ง๐š๐ฅ๐ฌ Game 3 on ABC and ESPN averaged ๐Ÿ๐Ÿ.๐Ÿ’ ๐ฆ๐ข๐ฅ๐ฅ๐ข๐จ๐ง ๐ฏ๐ข๐ž๐ฐ๐ž๐ซ๐ฌ, peaking at 13.9 million viewers.

๐ŸŽ๏ธ The 108th ๐ˆ๐ง๐๐ข๐š๐ง๐š๐ฉ๐จ๐ฅ๐ข๐ฌ ๐Ÿ“๐ŸŽ๐ŸŽ averaged a Total Audience Delivery (TAD) of ๐Ÿ“.๐Ÿ‘ ๐ฆ๐ข๐ฅ๐ฅ๐ข๐จ๐ง ๐ฏ๐ข๐ž๐ฐ๐ž๐ซ๐ฌ across NBC, Peacock, and NBC Sports digital platforms and peaked at 6.46 million viewers.

๐Ÿ’ The 2024 ๐๐‡๐‹ ๐„๐š๐ฌ๐ญ๐ž๐ซ๐ง ๐‚๐จ๐ง๐Ÿ๐ž๐ซ๐ž๐ง๐œ๐ž ๐…๐ข๐ง๐š๐ฅ (Game 6) on ESPN averaged ๐Ÿ‘ ๐ฆ๐ข๐ฅ๐ฅ๐ข๐จ๐ง ๐ฏ๐ข๐ž๐ฐ๐ž๐ซ๐ฌ peaking at 3.7 million. The series averaged 2.3 million viewers; through 41 Stanley Cup Playoff games, viewership averaged 1.4 million.

โ›ณ The second round broadcast of the ๐”.๐’. ๐Ž๐ฉ๐ž๐ง on NBC and Peacock produced a Total Audience Delivery (TAD) of ๐Ÿ.๐Ÿ‘๐Ÿ– ๐ฆ๐ข๐ฅ๐ฅ๐ข๐จ๐ง ๐ฏ๐ข๐ž๐ฐ๐ž๐ซ๐ฌ and peaked with nearly 3 million viewers.

โšฝ The UEFA European Championship Group Stage match on June 16 on FOX peaked at 2.2 million viewers.

โšพ ESPN’s Sunday Night ๐๐š๐ฌ๐ž๐›๐š๐ฅ๐ฅ coverage of the Boston Red Sox and New York Yankees on June 16 averaged ๐Ÿ.๐ŸŽ๐Ÿ• ๐ฏ๐ข๐ž๐ฐ๐ž๐ซ๐ฌ.

๐ŸŽ๏ธ๐…๐จ๐ซ๐ฆ๐ฎ๐ฅ๐š ๐Ÿ ๐‚๐š๐ง๐š๐๐ข๐š๐ง ๐†๐ซ๐š๐ง๐ ๐๐ซ๐ข๐ฑ on ABC had the largest live television audience on record, with an average of ๐Ÿ.๐Ÿ– ๐ฆ๐ข๐ฅ๐ฅ๐ข๐จ๐ง ๐ฏ๐ข๐ž๐ฐ๐ž๐ซ๐ฌ and a peak of 1.97 million viewers. The Miami Grand Prix in early May set the all-time F1 record for a live telecast with 3.1 million average viewers.

๐Ÿ€The ๐–๐๐๐€ game of the Indiana Fever versus the Chicago Sky averaged ๐Ÿ.๐Ÿ“๐Ÿ‘ ๐ฆ๐ข๐ฅ๐ฅ๐ข๐จ๐ง ๐ฏ๐ข๐ž๐ฐ๐ž๐ซ๐ฌ on ESPN, with viewership peaking at 2.19 million.

๐ŸฅŽ The NCAA Division I ๐’๐จ๐Ÿ๐ญ๐›๐š๐ฅ๐ฅ ๐–๐จ๐ฆ๐ž๐งโ€™๐ฌ ๐‚๐จ๐ฅ๐ฅ๐ž๐ ๐ž ๐–๐จ๐ซ๐ฅ๐ ๐’๐ž๐ซ๐ข๐ž๐ฌ Finals on ESPN drew ๐Ÿ.๐Ÿ— ๐ฆ๐ข๐ฅ๐ฅ๐ข๐จ๐ง ๐ฏ๐ข๐ž๐ฐ๐ž๐ซ๐ฌ and peaked at 2.5 million, making it the most-watched Game 1 on record.

โšฝ The UEFA European Championship Group Stage match on June 16 on FOX peaked at 2.2 million viewers

๐Ÿ€ Over Memorial Day Weekend, ION, CBS and NBA TV set viewership records for ๐–๐๐๐€ broadcasts, with ๐Ÿ•๐Ÿ๐Ÿ’,๐ŸŽ๐ŸŽ๐ŸŽ ๐ฏ๐ข๐ž๐ฐ๐ž๐ซ๐ฌ, peaking at 981,000.

๐ŸŽพ The final round of the U.S. Womenโ€™s Open on NBC had 943,000 viewers.

๐Ÿ€ CBS carried a ๐–๐๐๐€ game between the NY Liberty and the Minnesota Lynx, which drew ๐Ÿ•๐ŸŽ๐Ÿ’,๐ŸŽ๐ŸŽ๐ŸŽ ๐ฏ๐ข๐ž๐ฐ๐ž๐ซ๐ฌ, the highest viewership for a WNBA game on CBS.

๐Ÿˆ The ๐”๐…๐‹ game between the D.C. Defenders and the San Antonio Brahmas on FOX averaged ๐Ÿ”๐Ÿ–๐Ÿ’,๐ŸŽ๐ŸŽ๐ŸŽ ๐ฏ๐ข๐ž๐ฐ๐ž๐ซ๐ฌ, peaking at 1.3 million viewers.

โšฝ For the ๐๐ซ๐ž๐ฆ๐ข๐ž๐ซ ๐‹๐ž๐š๐ ๐ฎ๐ž 2023-24 season, Peacock averaged a Total Audience Delivery of ๐Ÿ“๐Ÿ’๐Ÿ”,๐ŸŽ๐ŸŽ๐ŸŽ ๐ฏ๐ข๐ž๐ฐ๐ž๐ซ๐ฌ per TV match. The Championship averaged a Total Audience Delivery of 2.9 million viewers across all TV and streaming platforms in English and Spanish.

StackPath Closing Down Company, Will Liquidate Assets

StackPath announced it is shutting down the company and will liquidate its assets. Employees posted comments on LinkedIn last week, and now the news is official. Company investors had been trying to offload the company for at least 18 months, with multiple vendors telling me they looked at the business but weren’t interested. Founded by the former chairman and CEO of SoftLayer Technologies, which was acquired by IBM in 2016, StackPath raised $180 million and acquired MaxCDN (SMB CDN), Fireblade (WAF), Cloak (VPN) and Staminus (DDoS) to launch the company. Read my launch blog post here.

In 2017, the company acquired CDN Highwinds, which had already acquired BandCon and in 2017, StackPath merged with Server Density to enter the monitoring business. In 2020, StackPath raised $216 million in a Series B round from Juniper and Cox to get into the edge computing business, suggesting that IoT, 5G and OTT video would be the driving demand. Last year, StackPath exited the CDN business, with Akamai acquiring “approximately” 100 enterprise CDN contracts from the company.

StackPath’s downfall was a constant change in management, no core product focus, no clear go-to-market strategy, no understanding of customer needs and calling themselves the “worldโ€™s first platform” for providing compute and services at the edge, which they weren’t. At one time, StackPath’s technology was the enhanced security option for Eero’s mesh Wi-Fi system, which StackPath was banking on to grow its revenue. However, that option disappeared when Amazon bought Eero in 2019.

There was also a lot of in-fighting between management and investors and far too many egos at the top. Between 2017 and 2019, I hosted multiple meetings with some of StackPath’s management team and was not impressed. The company was fast and loose with its numbers, overinflated revenue, customer deployments and other aspects of the business. By the time new management took over in 2020, I believed that the damage had already been done and that StackPath wasn’t saveable. For clarity, I last talked to StackPath’s management team in 2021, so my comments don’t pertain to all the new employees running the company with whom I have not interacted.

StackPath sent out its last invoices to customers on June 12th and is no longer offering technical support, which is a crummy way to close down a business when some customers are going to have technical questions.

Private Equity Firm Clearhaven Partners Acquires IP Video Transport Vendor Zixi

Private Equity firm Clearhaven Partners has acquired IP video transport vendor Zixi and will invest in the company, along with Zixi’s executive leadership team, which also invested in the transaction. Terms of the deal were not disclosed. Clearhaven Partners continues to add to their portfolio in the video space, having made a significant investment in Wowza Media Systems in 2021 and investing more than $100 million in SundaySky in 2022.

I got to spend some time with Clearhaven Partners at the NAB Show and like their core focus on the software business, emphasizing data, video and content. At the NAB Streaming Summit in April, Clearhaven’s Founder & Managing Partner, Michelle Noon, spoke about vendor valuations and the M&A outlook for streamers and streaming tech companies. You can watch that discussion here.

The Industry Lacks a Definition of TV and a Method for Measuring Viewership

Words matter. What is TV? Our industry continues to use words interchangeably as if they all have the same meaning when they don’t. TV is a device; itโ€™s not a type of content. Cable, satellite, and streaming are different means of distribution and video services. Netflix is not in the โ€œstreamingโ€ business; they are in the content business and use streaming to distribute their content. โ€œStreamingโ€ is not TV; itโ€™s a technology.

Today, many view the definition of TV as the type of content or viewing, and when used in that context, the word will not have a single definition. When a 30-second video clip on YouTube is being compared to a 90-minute movie on Netflix, as Nielsen does, under their definition of โ€œTV viewing,” the term no longer has a meaning. What is classified as watching TV varies amongst users. Many younger users think of their phone as their TV, and they would be right. For many, the TV is no longer considered a device but the act of viewing a particular type of content or specific user experience, no matter the screen size it is being watched on.

For some, that is content on YouTube; for others, like myself, I only consider it a TV viewing experience if the content is long-form and professionally produced. But itโ€™s not a right or wrong answer; itโ€™s simply a matter of viewer preference. Whatโ€™s being compared is the act of viewing video content, and what one person defines as content suitable for โ€œTVโ€ viewing will vary. There will never be an agreed-upon definition, and thatโ€™s ok. Whatโ€™s not ok is when companies like Nielsen put out video viewership data and use many of these terms without defining them. They intentionally confuse the market, which is part of their business strategy. The more complicated they make it, the more content owners and advertisers need to use Nielsen to attempt to figure it all out.

Nielsenโ€™s methodology for the Guage report comes from what they say are “TV householdsโ€ and “linear TV sources,โ€ the latter defined as “broadcast and cable.โ€ A household is a location, not a type of viewing. Cable is a method of distribution. Broadcast is a type of distribution, and today, one can rightfully argue that broadcast would be a channel like ABC and a live stream on YouTube from Red Bull TV โ€” two different types of distribution and business models.

When Nielsen measures viewership on Netflix, we know users watch long-form, professionally produced content. Thanks to Netflixโ€™s data, we know what that content is and whatโ€™s most popular. Yet, when Nielsen measures viewership on YouTube, we have no idea what type of content is being watched. A short user-generated instructional video on YouTube is being compared to a professionally produced long-form piece of content on Netflix. Thatโ€™s not comparable unless Nielsen was simply looking at the total hours spent with video services over other means of content consumption. Content owners of every type compete for our time and eyeballs, but thatโ€™s not what Nielsen is comparing.

Within the other category, Nielsen doesnโ€™t count “high-bandwidth video streaming,โ€ which has no definition. The bitrate of a video has never been one of the factors Niselen uses in measuring, and they donโ€™t even collect bitrate data across services. Yet they use the bitrate of a video to define why they donโ€™t include vMVPD services in the total viewing time, which makes no sense.

Nielsen doesnโ€™t define viewing TV viewing by the average length of a title or type of content, which would be far more valuable. We have no idea what kind of content is being viewed on YouTube or even what percentage of it is being monetized. Netflix isnโ€™t free. All content on YouTube is. What would be very helpful to know and track is what percentage of content being viewed on YouTube is also being delivered with ads and how that trends over time.

As an industry, no one wants to agree upon even a core set of definitions and methodology when comparing all forms of video. This is a problem and where we need to start. Content type, length, genre, distribution type and business models are all variables of any video service. But we should start with the basics regarding the length of content, type of content (UGC versus professionally produced) and average viewing time. Simply calling everything TV isn’t helpful. Words matter.

NFL Games in 2024 Will Be Broadcast Across Ten Networks and Platforms, But Viewers Keep Watching

For the 2024 NFL season, games will be broadcast and streamed across ten different networks and platforms. That’s great for the NFL’s revenue, but the fragmented distribution is bad for fans. The NFL can get away with this since, in 2023, NFL programming accounted for 93 of the 100 highest-rated shows on TV. Adding two games on Netflix this year allows the NFL to grow its audience, with the Netflix deal being the first that allows for global distribution with no blackout restrictions. Hereโ€™s a breakdown of how many games are on each platform:

  • Amazon Prime Video: 16 games (all streaming exclusive)
  • Peacock: 1 game (streaming exclusive)
  • ESPN+: 1 game (streaming exclusive)
  • Netflix: 2 games (streaming exclusive)
  • NFL Network: 4 games (all games also on NFL+)
  • NBC: 17 games (all games are also on Peacock)
  • FOX: At least 100 games (week 18 schedule still TBD, all games streaming via FOX Sports)
  • CBS: At least 100 games (week 18 schedule still TBD, all games streaming via Paramount+)
  • ESPN/ABC: 21 games (all games streaming via ESPN+ or ABC)
  • * One could suggest that YouTube TV could also be added to the list since that deal is direct with the NFL, whereas games on Fubo and Hulu+ Live TV are deals that vMVPDs do with the broadcast networks.
  • * On the B2B side, Everpass has a deal with the NFL for viewing in bars and restaurants
  • * Also on the B2B side, Reach TV has a deal with the NFL for viewing in airports

In a CNBC interview, Brian Rolapp, NFL’s chief media and business officer, was asked how he addresses concerns that the market is too fragmented and that it’s too hard to find games. As expected, he said he “doesn’t think it’s fragmenting too much” for the NFL since “every game we have is on broadcast television in the local markets.” While this is technically accurate, it requires an antenna to get an Over-The-Air (OTA) signal, and you can’t pause or rewind an OTA signal without paying for a DVR. Suggesting there is no fragmentation due to OTA availability is a poor argument. Fans have to go out and buy additional equipment to get the broadcast, and watching an NFL game via OTA is not the same experience as viewing the game via a cable or satellite network.

Unless viewership declines or stays flat over the next year or two, the NFL can continue to put revenue over the fan experience. As frustrated as fans are with today’s sports viewing experience, the NFL has no incentive to change its fragmented distribution strategy as long as fans continue to watch games, no matter how complex the NFL makes it.