
When It Comes To Cache Hit Ratio And CDNs, The Devil Is In The Details
The term “cache hit ratio” is used so widely in the industry that it’s hard to tell what exactly it means anymore from a measurement standpoint, or the methodology behind how it’s measured. When Sandpiper Networks first invented the concept of a CDN (in 1996), and Akamai took it to the next level by distributing the caching proxy “Squid” on a network of global servers, the focus of that caching at the time was largely images. But now we need to ask ourselves if focusing on overall cache hit ratio as a success metric is the best way to measure performance on a CDN.
In the late 90’s, much of the Internet’s web applications were being served from enterprises with on premise data centers and generally over much lower bandwidth pipes. One of the core issues Akamai solved was relieving bandwidth constraints at localized enterprise data centers. Caching images was critical to moving bandwidth off the local networks and bringing content closer to the end user.
But fast forward 20 years later and the Internet of today is very different. Pipes are bigger, applications are more complicated and users are more demanding with respect to performance, availability and security of those applications. So, in this new Internet is the total cache hit ratio for an application a good enough metric to consider, or is there a devil in the details? Many CDNs boast of their customers achieving cache hit ratios around 90%, but what does that really mean and is it really an indicator of good performance?
To get into cache hit ratios we must think about the elements that make up a webpage. Every webpage delivered to a browser is comprised of an HTML document and then other assets including images, CSS files, JS files and Ajax calls. HTTP Archive tells us that, on average, a web page contains about 104-108 objects per page coming from 19 different domains. The average breakdown of asset types served per webpage from all HTTP Archive sites tested looks like this:
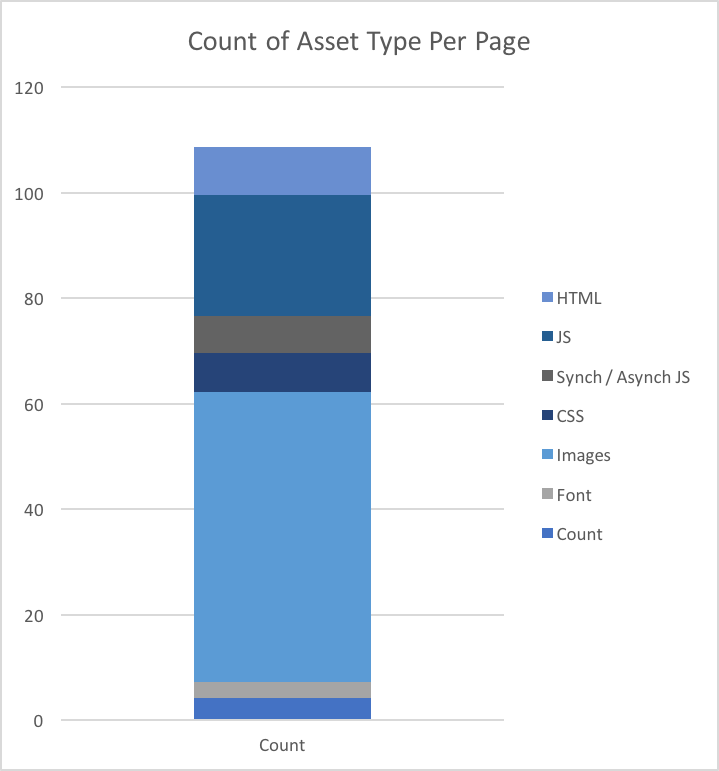 Most of the assets being delivered per web page are static. On average 9 may specifically be content type HTML (and therefore potentially dynamic) but usually, only one will be the initial HTML document. An overall cache hit rate for all of these objects tells us what percentage of them are being served from the CDN, but does not give developers the details they need to truly optimize caching. A modern web application should have most of the images, CSS files and other static objects served from cache. Does a 90% cache hit ratio on the above page tell you enough about the performance and scalability of the application serving that page? Not at all.
The performance and scalability of a modern web applications is often largely dependent on its ability to process and serve the HTML document. The production of the HTML document is very often the largest consumer of compute resource on a web application. When more HTML documents are served from cache, less compute resource is consumed and therefore applications become more scalable.
HTML delivery time is also critical to page load time and start render time, being the first object delivered to the browser and a blocker to all other resources being delivered. Generally, serving HTML from cache can cut HTML delivery time to circa 100ms and significantly improve user experience and their perspective of page speed. Customers should seek to understand the cache hit ratio by asset type so developers can specifically target improvements in cache hit rates by asset type. This would result in achieving faster page load times and a more scalable application.
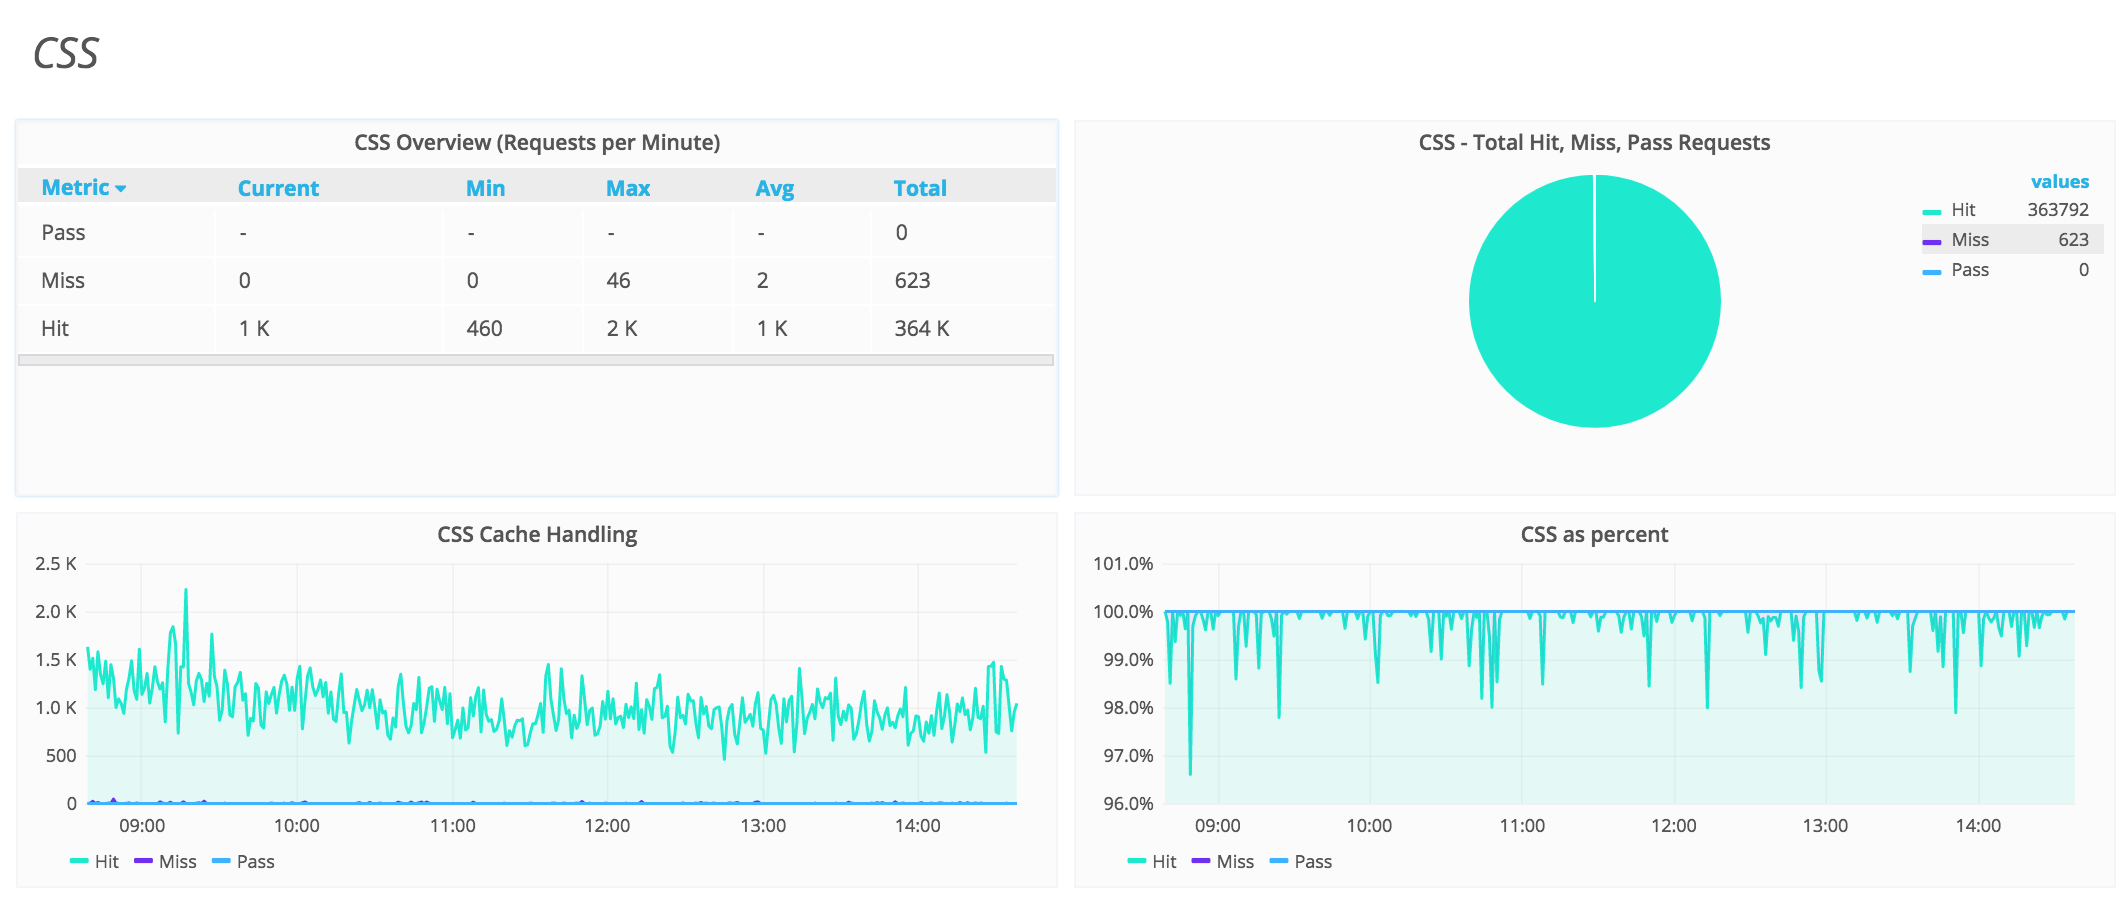
For example, seeking closer to 100% cache hit rates for CSS files, JS files and possibly images would seem appropriate.
 As would understanding what cache hit rate is being achieved on the HTML.
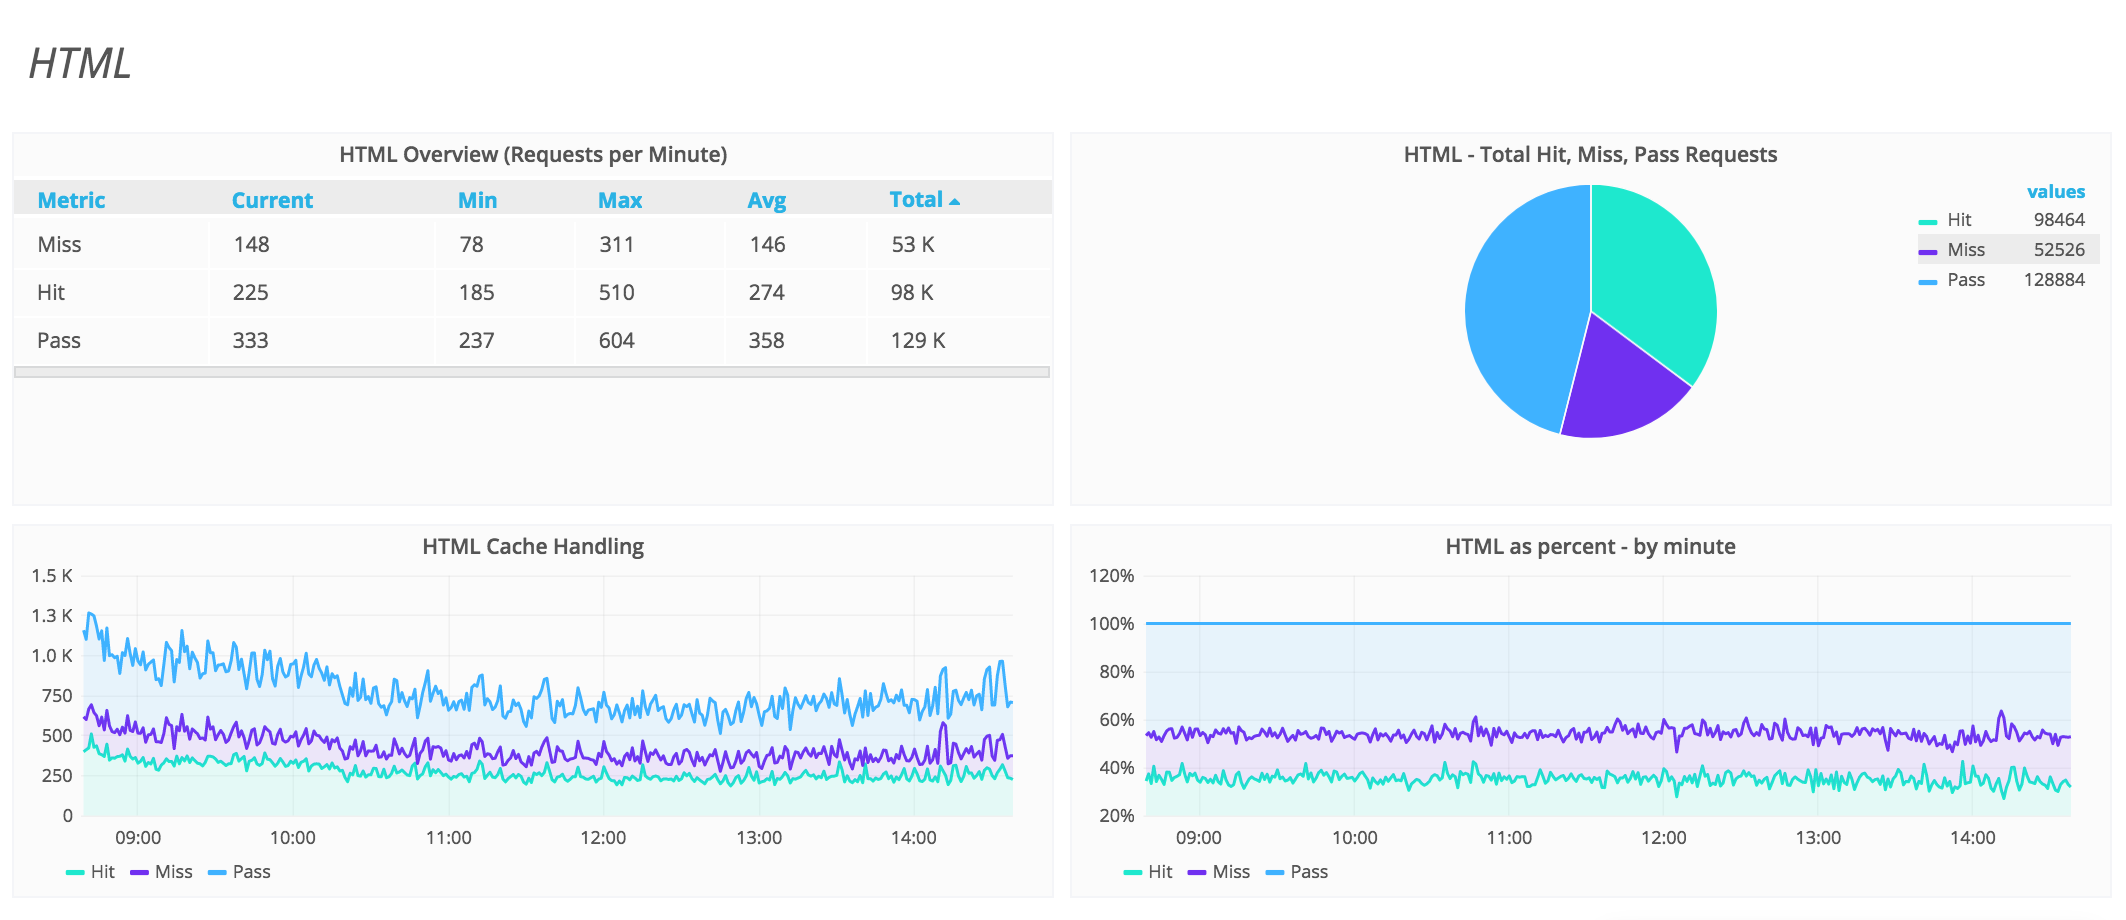 [*Snapshots from the section.io portal]
While not all HTML can be served from cache, the configurability of cache solutions like Varnish Cache (commercially available through Varnish Software, section.io and Fastly) and improved HTML management options such as HTML streaming (commercially available from Instart Logic and section.io) have made it possible to cache HTML. In addition, new developer tools such as section.io’s Developer PoP allow developers to more safely configure and deploy HTML caching without risking incidents in production.
Many CDNs focus on overall cache hit rate because they do not encourage their users to cache HTML. A 90% cache hit rate may sound high, but when you consider that the 10% of elements not cached are the most compute-heavy, a different picture emerges. By exposing the cache hit ratio by asset type, developers are able to see the full picture of their caching and optimize accordingly. This results in builders and managers of web applications who can more effectively understand and improve the performance, scalability, and user experience of their applications and is where the industry needs to head.