
Conviva Unveils Industry Portal Benchmarking QoE Metrics For Video
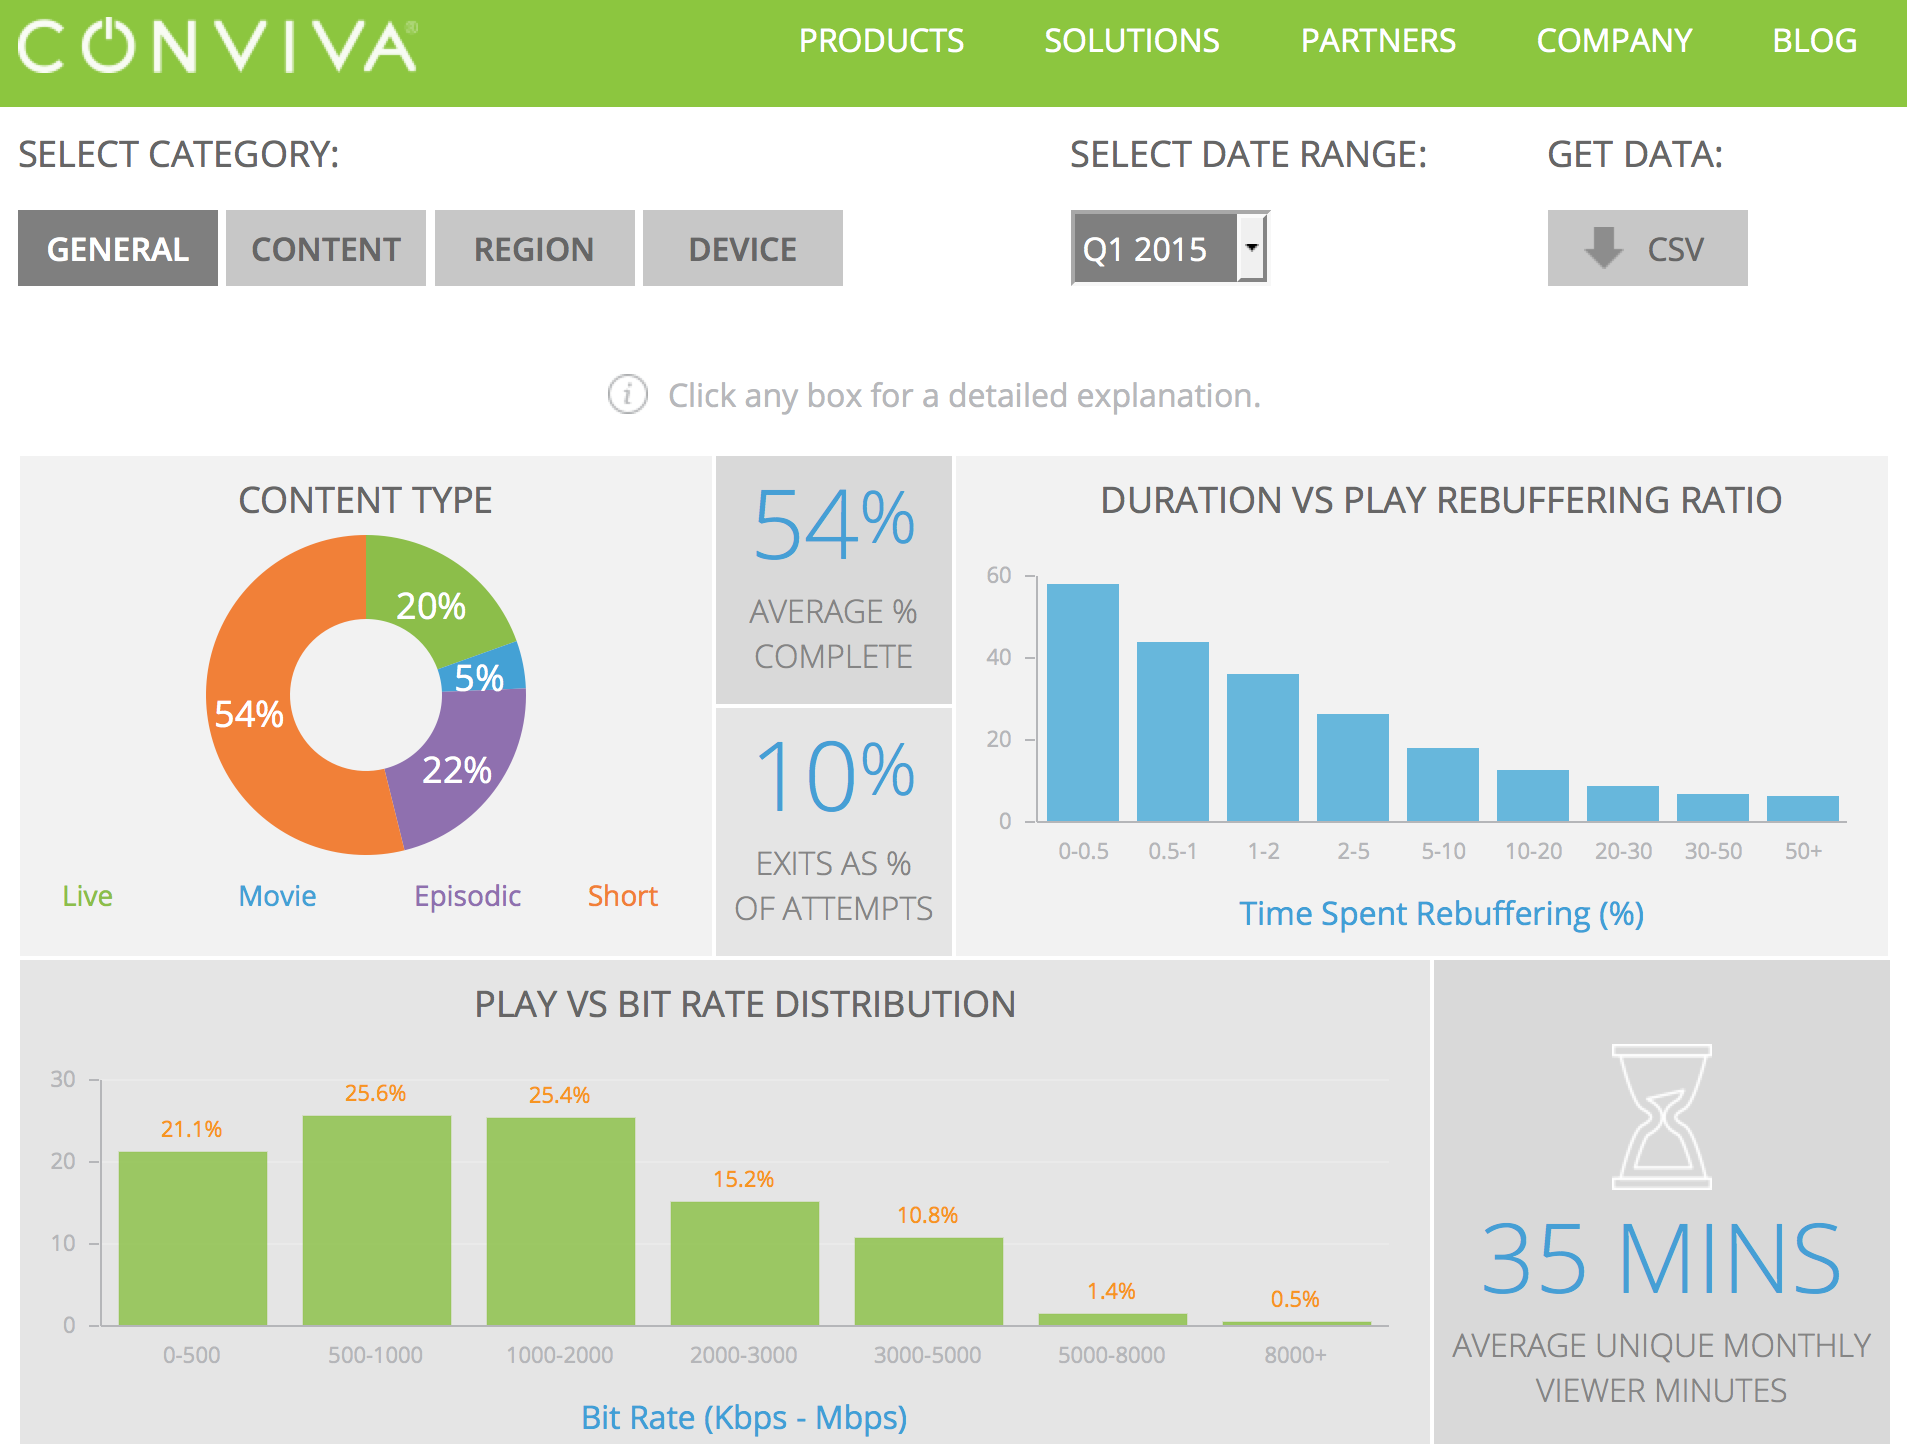
Conviva has released their Industry Data portal, which provides analysts and the general public access to video quality and engagement metrics by quarter, by region, by content type and by device. The Industry Data portal provides access to quality and engagement data for streaming video, which was only previously available to a small group of insiders. Unlike traditional audience measurement estimates provided by Nielsen or comScore, Conviva’s portal focuses on quality and experience metrics—such as video startup times by region, the average bitrate by device, and the rebuffering ratio by content type—across device categories of desktop, wifi, tablet, and connected TV devices.
 The source of the data is comprised of Conviva’s global intelligence network and includes data from premium media companies including HBO, ESPN, Viacom, CBS, Sky, Foxtel, and Yahoo. This information can be used to assess performance of Internet delivered video for benchmarking purposes, for geographic expansion, or for evaluation of the success of an OTT offering. Conviva has made it simple for analysts and others to download the data so that business analysts might draw high-level insights into the performance of streaming videos. Conviva gave me some additional details on the data collected and the methodology:
- Methodology — processed data for the quarter using Conviva’s real-time Big Data platform
- Data — will have historical data as well as those for the most recent quarter-end
- Anonymized and segmented by device, region, and content type
- What’s being measured — Quality of Experience, Engagement and Audience metrics, including VST, exits before video start, re-buffering ratio, playtime, bit rate distribution
- Source of Data — all companies within Conviva Global Intelligence Network, including premium media companies such as HBO, ESPN, Viacom, CBS, Sky, Foxtel, Yahoo
- Periods — quarterly starting from Q4 2014 (should be available soon — Q1 2015 is there now) to the present
- Devices — Conviva separates the data by desktop, mobile – wifi, mobile cellular, tablet wifi, tablet cellular, TVs/TV devices
The data which Conviva provides to paying customers is much more in-depth, which applies to all dimensions stated above. From an aggregation perspective, Conviva wanted to provide actionable, insightful information about QoE for the OTT industry, which is info that many OTT providers don’t share on their own. There is some good data in their portal that you can check out at www.conviva.com/industry-data-portal