The Real CDN Market Share Numbers
In my eyes, the worst data that is routinely quoted in the market in all forms is the percentage of market share that any CDN vendor has in the market. None of those numbers are accurate because they are not backed up by any real data simply due to the fact that CDN providers and content owners do not release the majority of their data to the public or to research houses. For all those research reports you see about the size of market share, the number of streams delivered etc… all of the CDNs will tell you if you ask them that they provided ZERO data, other than what is already public, to the analysts who write the reports.
In two different articles about content delivery vendors last week, one said Akamai had 60% of the CDN market share and the other one said 80% market share. Which one is it? That’s a big difference in a market that is a few hundred million dollars. I see reports that say Limelight Networks has 10% market share and I also hear numbers up to 25% market share. So which is it? The answer is, no one truly knows. And the question we should be asking is why does anyone care? Does size or market share equal long term success?
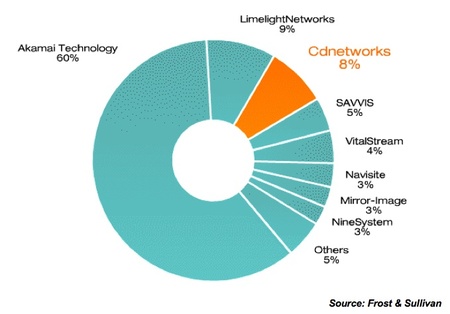
Recently, when speaking with CDNetworks they said they had 8% of the market share for CDN services and that Limelight Networks had 9%, based solely on revenue. When I asked where those numbers came from, the said from a Frost & Sullivan report on CDNs and they included a slide in their presentation showing the data.
I’ve see this data before from the Frost & Sullivan report as many use it, but it is just plain wrong. Not my opinion, but fact based on how they present the data. Even in the slide shown above, they contradict themselves with the data. We know that Limelight Networks did $64.3 million last year and that CDNetworks did $38.5 million. That’s a difference of $25.8 million. So how does that equal 1% difference in market share? And we know that VitalStream last year did $24 million before the Internap acquisition. So the different between CDNeworks and VitalStream is $14.5 million. But that $14.5 million apparently represents 4% of the market share? The numbers just don’t add up.
And the biggest problem with all of these reports is that none of them say anything about what market share they are talking to. Is this the CDN market share for all CDN products including those CDN services used to deliver JPG’s and GIF’s? Or is this the CDN market share just for the delivery of audio and video content? And is this the global market share or the market share in the U.S.? If it is global, then why aren’t companies like ChinaCache included? If it is global CDN market share numbers, they may say that ChinaCache is included in the slice on the chart that says "5% other". But the problem is that ChinaCache did over $10 million last year in revenue, so clearly they would not be included in the other companies that make up the 5%.
Some will say why do I care, at least someone is tying to put out some numbers on the market. That may be, but putting out numbers is useless unless the data is accurate. So what are the real market share numbers? No one knows. And no one will know unless all of the CDNs publish their revenue or the volume of data or streams they deliver. In order to compare one to the other to determine the market share, you have to have a metric to measure them all by.
Market share numbers do not matter. Revenue, profit and a sustainable business model is all that matters and those are not reflected in market share numbers. Netscape had more market share than IE, then what happened a few years later? Did their market share matter anymore? No, because their business model no longer worked. There are lots of examples like this. The industry should be focusing on the business and the long-term opportunities in the market and not where a company shows up on a pie chart.

