Fox Corporation to Acquire Roku: Close in the First Half of 2027, $22B in Enterprise Value
The rumors are true. Fox Corporation announced it has agreed to acquire Roku for $160 per share, in cash (60%) and Fox common stock (40%), valuing Roku at approximately $22 billion in enterprise value. Fox is taking on new debt to fund the deal and has secured $12 billion in fully committed bridge financing from Morgan Stanley.
The deal is expected to close in the first half of 2027, and upon closing, existing FOX shareholders are expected to own approximately 73% of the combined company, with Roku shareholders owning approximately 27%. Fox originally invested in Roku in 2013, participating as an early, pre-IPO investor
Fox says the deal is expected to be accretive to free cash flow per share by the second full year after closing and to achieve approximately $400 million in run-rate cost synergies, with additional revenue upside. In 2021, Roku’s Stock hit an all-time high of $479.50 during the pandemic-driven streaming boom, but it quickly declined to under $100 a year later. From April 2022 to December 2025, Roku’s stock only briefly peaked above $100 per share.
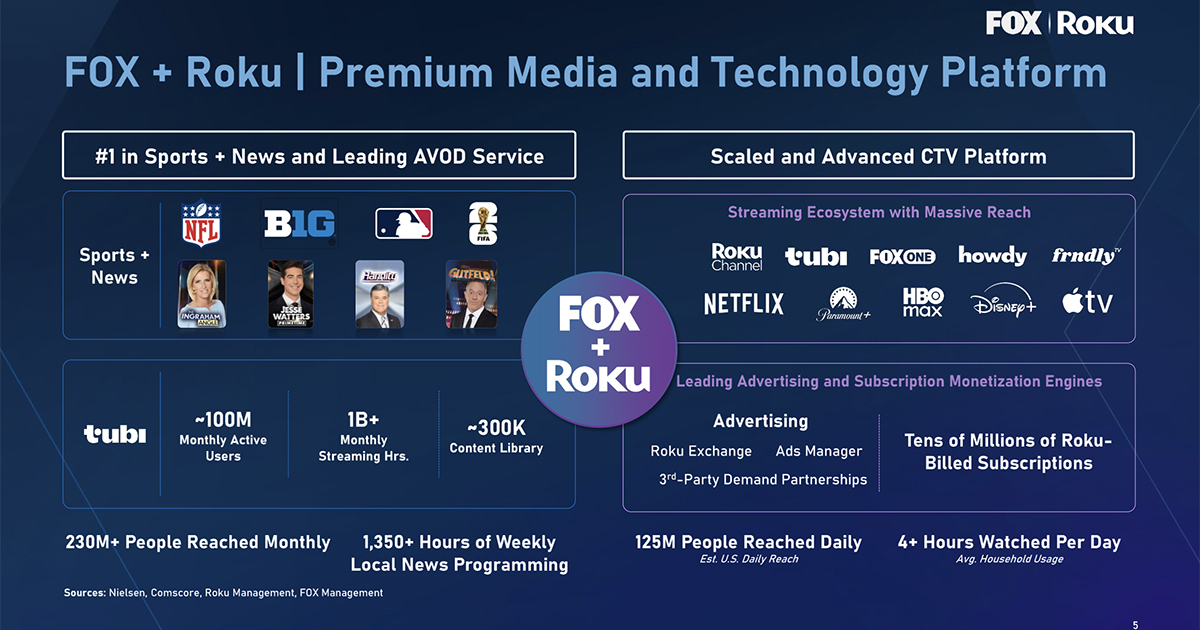
As expected, Roku will remain an open platform, and content from other companies will continue to be supported and promoted, with a continued focus on an aggregation strategy. Fox said they plan to keep Tubi and The Roku Channel separate after the deal closes, noting that about a third of their audiences overlap. While the combination of Fox and Roku brings together news and sports channels with two free streaming services, it’s the advertising side of Roku’s business that’s most valuable. Based on Wall Street estimates, the deal values Roku at 24x FY27E EBITDA.
During Roku’s Q1 earnings, the company broke out advertising and subscription business for the first time, with advertising revenue of $613M, up 27% YoY. Subscription revenue was $519M, up 30%. Total revenue for the quarter was $1.248B, up 22% YoY on net income of $85.7M. Revenue from device sales was less than 10% of total revenue, at $118M, down 16%. Streaming hours across the Roku platform were up 8% to 38.7 billion. Roku ended Q1 with $2.38 billion in cash and cash equivalents on hand, with zero long-term debt.
As part of the deal, Anthony Wood, founder, chairman and CEO of Roku, will join the Fox board. The Fox and Roku investor presentation is located here.

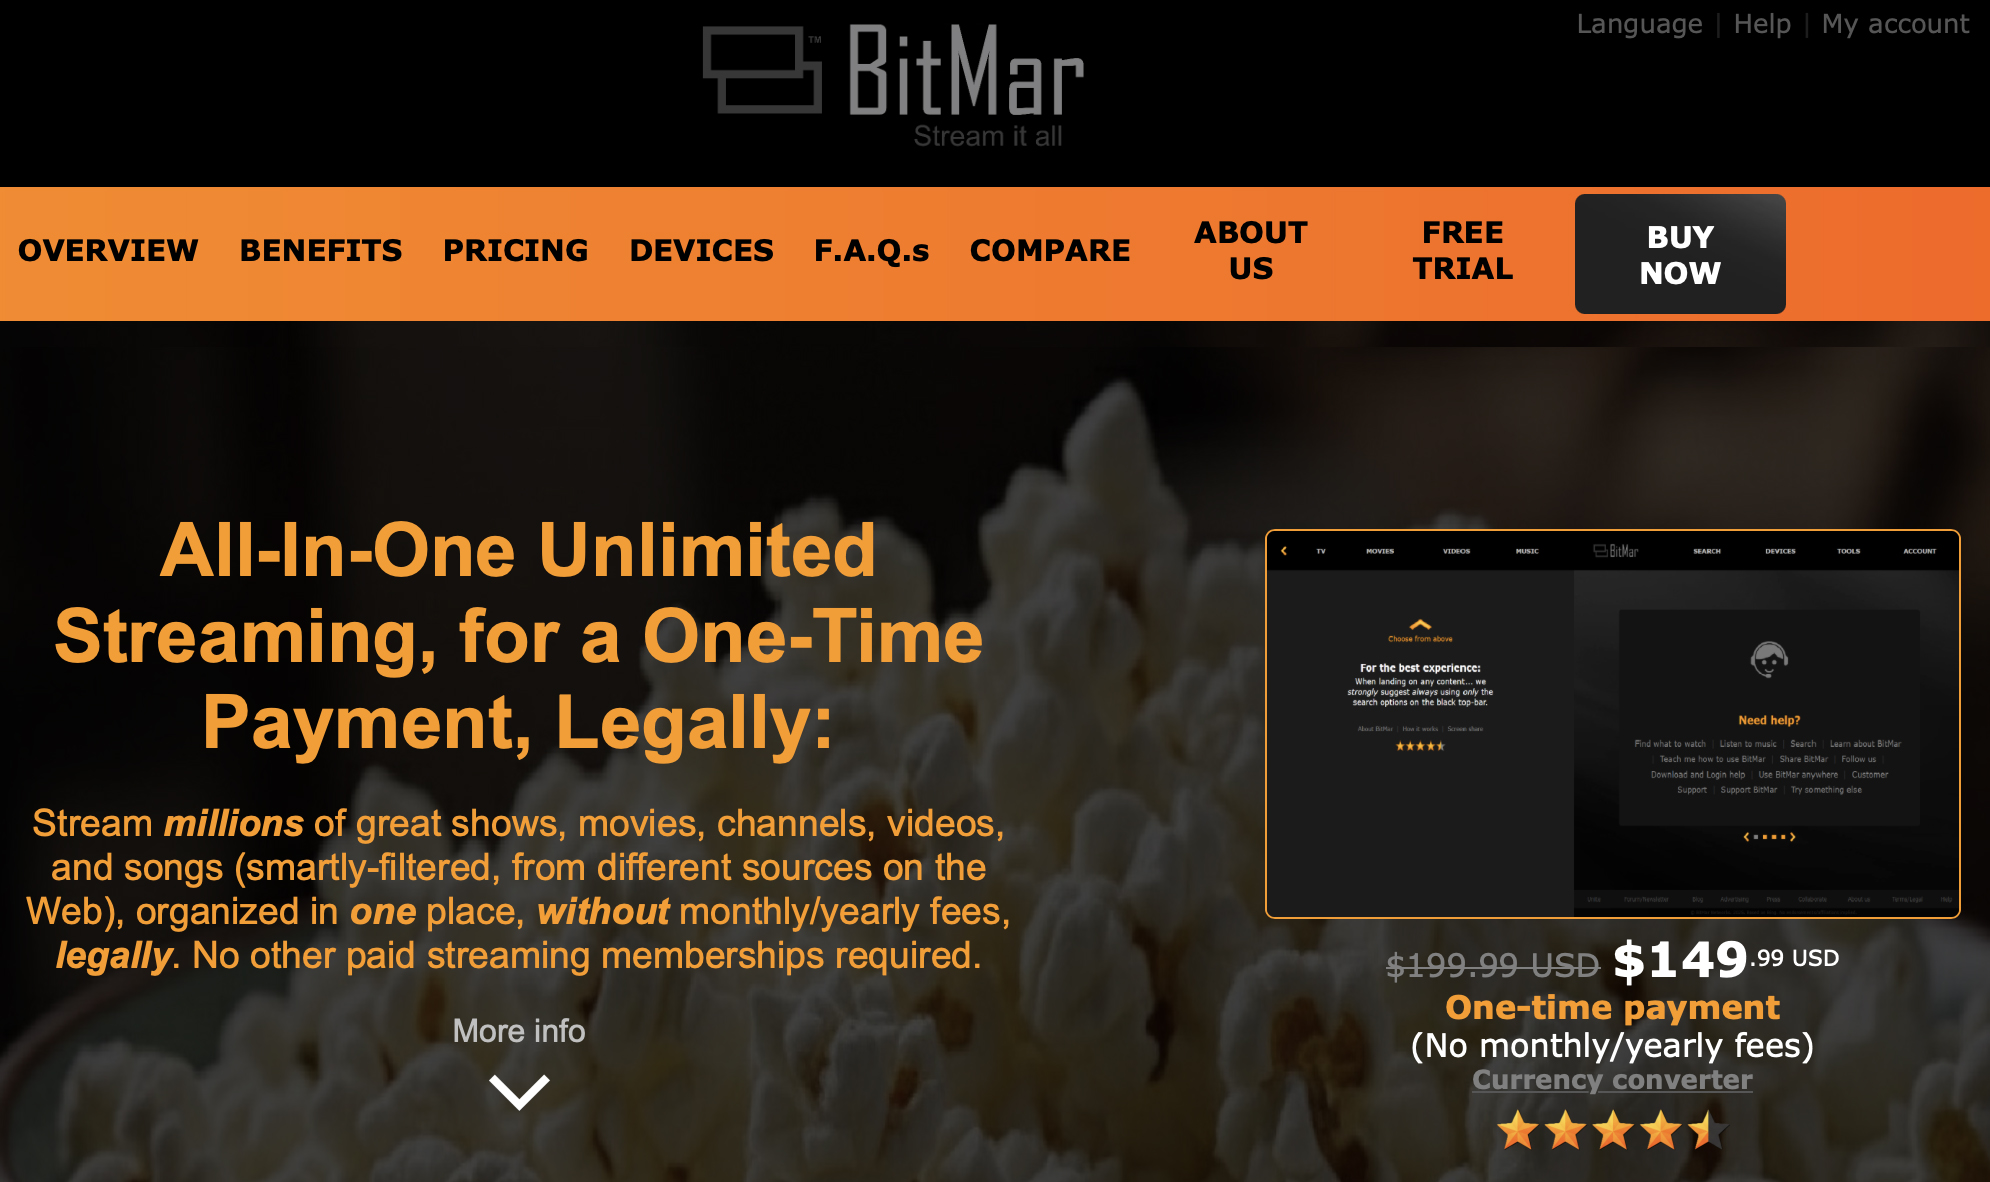 A company called BitMar, which promises to “stream everything legally,” is scamming people out of $150 by linking to free YouTube content via Bing search and Pluto TV. The CEO reached out, offering me a “personal lifetime membership” and hoping I would “inform my audience” about the service. I’ll be happy to inform them. Stay away from BitMar!